


This article looks at predicting and controlling the crystallinity of molecular materials. It will help you understand the research the journal article is based on, and how to read and understand journal articles. The research article was originally published in our CrystEngComm journal.
Will it crystallise?
Predicting crystallinity of molecular materials
Click here for the full article in the journal CrystEngComm
Click here for the article in Chemistry World
Authors: Jerome G. P. Wicker and Richard I. Cooper
Why is this study important?
In this study the authors show how an algorithm can be trained using a large quantity of existing data to predict whether a molecule is likely to form crystals.
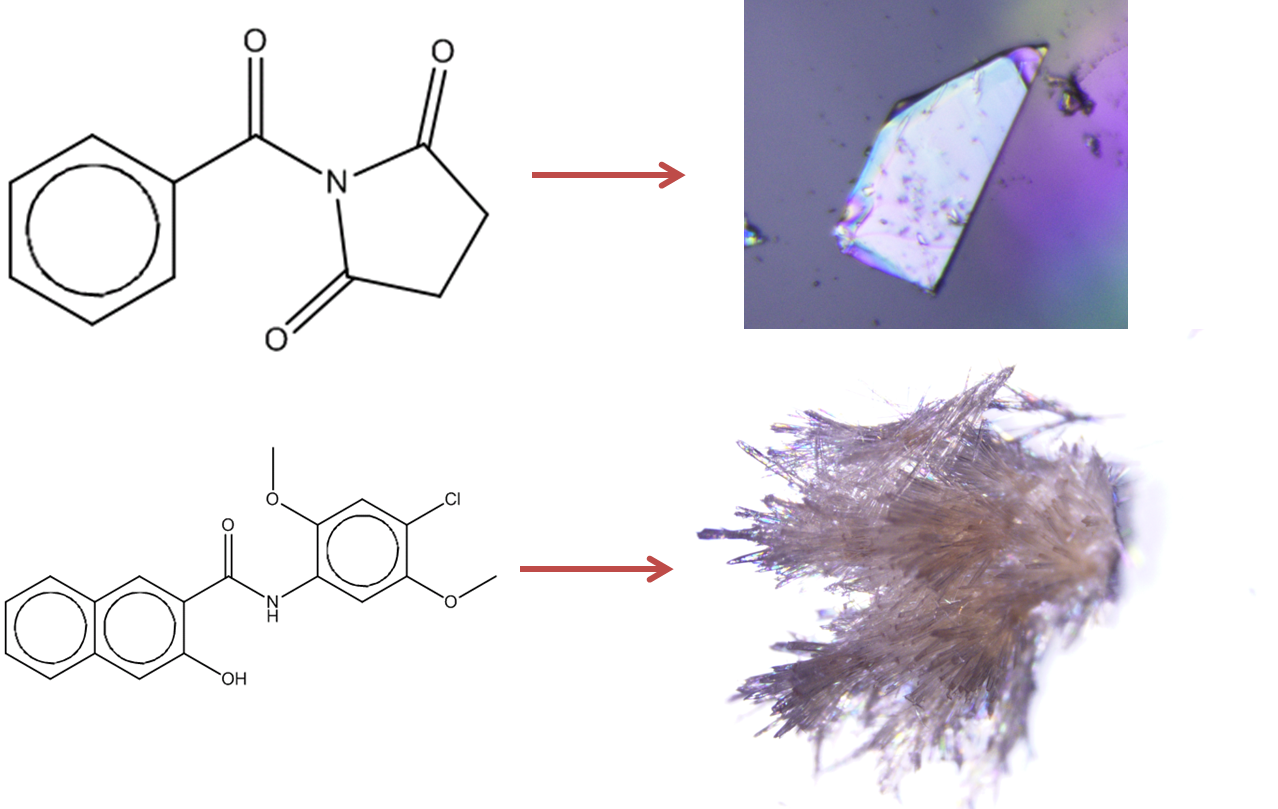
Figure 1: Prediction of crystallisation likelihood from the information in a 2D molecular diagram.
Getting molecules to crystallise can be an essential step in both research and industrial processes. Therefore predicting in advance whether crystals are likely to form can help to guide experiments in many situations. Examples include:
- Single crystals of a material can be used to confirm or understand its three-dimensional atomic structure and connectivity by X-ray diffraction. Knowledge of whether a material is likely to crystallise can help to prioritise recrystallisation experiments and can be used to predict chemical modifications to increase the chances of crystals growing.
- Unpredictable spontaneous crystallisation of molecules during a chemical production process could result in loss of product or clogging of equipment. Predicting which chemical changes to a molecule would reduce the likelihood of spontaneous crystallisation could help to address these problems.
- The crystallinity of a pharmaceutical material can change physical properties of the solid form, such as its solubility and hence bioavailability of the drug in the body.
A related problem is the prediction of the three-dimensional structure of molecular crystals. Research into this field has made steady progress over the last few decades, with a series of crystal structure prediction blind tests1–5showing an improving success rate; however it is a very computationally intensive problem and starts from the assumption that a material will form crystals.
This study analyses a large quantity of carefully selected data using an approach known as ‘machine learning’. Several types of machine learning algorithms exist and have been successfully applied to problems such as prediction of the lower flammability limit,6 solubility,7 heat capacity,8 and melting point9 of organic molecules. The authors also note several existing reports of machine learning which aim to predict protein crystallinity based on their amino acid sequence.10
The study identifies the features of a molecule which have the most influence on the accuracy of crystallinity predictions, and this allows some insight into the mechanisms of crystallisation and rationalisation of known crystallisation behaviour.
Further information
- A paper on 'Predicting the self-assembly of a model colloidal crystal'
- A paper on 'Crystal templating through liquid–liquid phase separation'
- A paper on 'Innovation in crystal engineering'
- A paper on 'Discovering crystals using shape matching and machine learning'
- Selected further reading from RSC books:
- Crystal Growth and Nucleation
- Crystallisation - A Biological Perspective
What is the objective?
The authors’ aim was to train a computer algorithm so that it could accurately classify molecules as either crystallisable or non-crystallisable using properties of the molecules calculated from just the atomic connectivity and element types. They then set out to identify the most important factors governing the crystallinity of the molecules by analysing the influence of the input information on the accuracy of the trained algorithm.
What was their overall plan?
- Identify an appropriate definition of a “crystalline” material
- Create a dataset containing crystalline and non-crystalline molecules
- Train machine learning algorithms using this dataset to create predictive models which can distinguish between crystalline and non-crystalline molecules
- Use the predictive models to classify molecules in a previously unseen test dataset, to assess the predictive accuracy of each model
- Verify the accuracy of the model experimentally by attempting to recrystallise a small selection of molecules
- Identify the features of the molecules which are most important for successful classification
What was their procedure?
Identify an appropriate definition of a “crystalline” molecule
The authors state that there is a continuum between large, perfect crystals and completely amorphous materialsvia micro-crystalline materials and powders. Classification of the degree of crystallinity is a challenging problem, but they note that in order for results to be published from a single crystal X-ray diffraction experiment a crystal with dimensions of at least 0.1mm (within an order of magnitude) was very probably obtained. This forms a convenient point along the continuum for the authors to draw a classification boundary – thus if a structure of a molecule has been determined by single crystals X-ray diffraction, they class it as “crystalline”, otherwise it will be called “non-crystalline” – subject to further caveats in the next section.
Figure 2: Crystal structure determination options for various crystallite sizes.
Create a dataset containing crystalline and non-crystalline molecules, using pre-existing databases
The authors ensured that all of the molecules used for training and testing in this study were contained in the ZINC11 database, which contains biologically relevant purchasable molecules from many chemical suppliers. Molecules which were contained within both ZINC and the Cambridge Structural Database (CSD)12 provided a subset which could be used as a reliable data source of crystalline molecular materials, since the CSD is almost entirely composed of molecules whose crystal structures have been determined by single-crystal diffraction. The remaining ZINC molecules were used as a data source of non-crystalline molecular materials, which is only an assumption since recrystallisation of a ZINC molecule may never have been attempted, or the molecule may not have been studied by SXRD, so some of this subset may actually be crystalline. The authors recognise that this assumption is fundamental to the success of this method and later use a blind recrystallisation trial to demonstrate that the bias introduced by this assumption is small. These resulting data sets of crystalline and non-crystalline molecules are both subsets of the ZINC database and therefore the machine learning does not simply learn to distinguish between ZINC’s commercially available molecules and ‘research’ compounds which are more likely to be found in the CSD.
The authors removed organometallic complexes and molecules which were reported or sold as salts from these datasets to focus on organic molecules. Solvents of crystallisation were deleted from input molecules, as these can be considered “crystallisation conditions” and their aim is to predict whether a molecule will crystallise, rather than the exact conditions required for it to do so. A further filter was applied to give subsets suitable for training the machine learning algorithms in a reasonable time, by applying some very general conditions proposed by Lipinski13,14 to identify “drug-like” molecules. These include a maximum molecular weight and limits on number of hydrogen bond donors and acceptors – a full list is reproduced in the orginal journal article supplementary information.
Finally, the size of the crystalline and non-crystalline data sets needs to be balanced to avoid class bias effects (for instance, if 99% of the input data is non-crystalline it is trivial to predict the class with 99% accuracy). The authors selected a random subset of the non-crystalline ZINC dataset so that it matched the size of the CSD crystalline set.
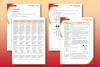
Table 1 – breakdown of training and test dataset numbers
Non-crystalline | Crystalline | Total | |
Training | 13 440 | 13 453 | 22 733 |
Test | 4480 | 4485 | 8965 |
Total | 17 920 | 17 938 | 35 858 |
For each molecule, the authors calculated a set of descriptors using a cheminformatics toolkit called RDKit.15 A descriptor is any single number that can be calculated from the 2D representation of the molecule and examples range from simple calculations such as ‘number of atoms’ right through to other predicted properties, such as the predicted solubility. The list of descriptors calculated is shown below, and it is these descriptors which the machine learning algorithm uses to make predictions. These descriptors must be scaled for use with some algorithms, while others can make predictions using the unscaled descriptors.
Train machine learning algorithms using this dataset to create predictive models which can distinguish between crystalline and non-crystalline molecules
The authors use “supervised classifier machine learning algorithms” which can make predictions based on the descriptors of the entries in the dataset by finding an algorithm to reproduce known output values from the input data. In their study the training data has a determined output value of “crystalline” or “non-crystalline” and the machine learning algorithm determines a model to give the best predictions for the training data. It is then judged by its success rate predicting the crystalline state of a previously unseen test data set. In this way the algorithm “learns” from prior observations in order to predict on new observations.
The authors compared the results of two types of machine learning algorithms: support vector machine (SVMs) and random forests (RF). They selected data to train the algorithms by randomly selecting 75% of each of the non-crystalline and crystalline datasets and labelled each entry with the known classification (0 for noncrystalline, 1 for crystalline).
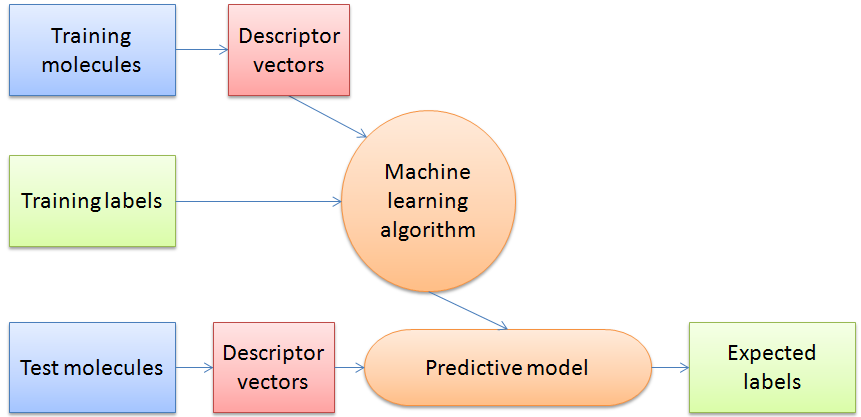
Figure 3: Schematic overview of a general machine learning procedure.
Use the predictive models to classify molecules in a previously unseen test dataset, giving a measure of the predictive accuracy of each model
The training data itself can be successfully predicted with 94.4% accuracy, but this is not a useful measure of the predictive power of the machine learning algorithm as, given enough input descriptors, they can be overtrained and effectively become a look-up table for the training data. Instead, the authors take the previously unseen 25% of each set and use the predictive model to attempt to assign labels. This test set gives a measure of the expected accuracy of each model when applied to real data sets by comparing predicted and known classifications for molecules which have not previously been seen by the model. The predictive accuracy of three machine learning algorithms trained using all 177 descriptors generated using RDKit are compared below.
Table 2 - Confusion matrices of drug-like molecules using RDKit descriptors for a) Linear SVM b) RBF SVM c) RF
Key | SVM (linear) | SVM (RBF) | RF |
T (NC) F (NC) | 86.3% 13.6% | 87.9% 12.1% | 83.2% 16.8% |
F (C) T (C) | 8.6% 91.4% | 7.2% 92.8% | 15.5% 84.5% |
Overall | 88.9% | 90.3% | 84.4% |
The authors report that the second SVM algorithm (using an ‘RBF kernel’) gave the highest percentage accuracy of 90.3%. Confusion matrices in Table 2 show this model also misclassifies the fewest molecules for each class and is particularly accurate on the crystalline dataset.
Verify the accuracy of the model experimentally by attempting to recrystallise a small selection of molecules
Next the authors set out to test for bias caused by the underlying assumption that the set of molecules in ZINC and not the CSD were not easily crystallisable, since this assumption would also affect the test data. They carried out a blind recrystallisation screen using a diverse set of 20 test molecules not present in the CSD of which 12 molecules were predicted to be crystalline (class F (NC)) and 8 were predicted to be non-crystalline (class T (NC)). After recrystallisations of these samples by slow evaporation from a range of solvents they discovered that 1 of the 12 crystalline samples was not the compound ordered, and it was rejected at this stage. From the remaining 11 samples, 7 yielded crystals large enough to carry out single crystal X-ray diffraction. From the set of 8 samples predicted to be non-crystalline, no crystals of sufficient size and quality were obtained.
Overall, they obtained a predictive accuracy of 79% which, when taking into account the granularity of the statistics of using only 19 samples, gives a broadly similar accuracy to their theoretical test. They argue that small errors in the non-crystalline training set have only a minor impact on the effectiveness of the model.
Identify the most important features of the molecules involved in this classification
To identify the two most important molecular descriptors for making these predictions the authors ran an independent feature selection analysis. They compared the accuracy of classifiers built using only two descriptors and the pair of descriptors which gave the highest percentage accuracy were chosen.
The authors found that the pair of most significant descriptors were:
(a) the 0χv index,16 which even by itself gives a predictive accuracy of 77.2%.
(b) and rotatable bond count (RBC).
Together this two-descriptor classifier gave a predictive accuracy of 80%, demonstrating that a large proportion of the accuracy obtained with 177 descriptors can be achieved using just two descriptors. The distribution of crystalline and non-crystalline materials with these two descriptors is shown in Figure 4.
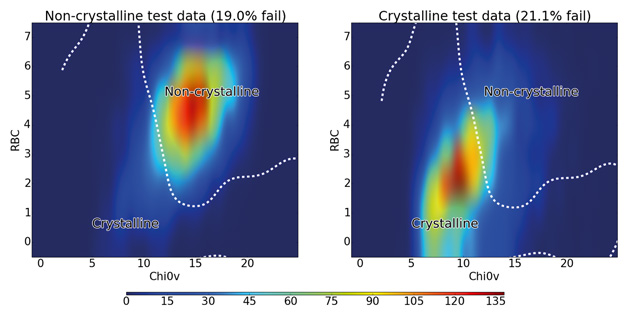
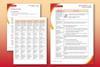
Figure 4: Distribution of rotatable bond count against 0χv for all test molecules colour-coded by density of molecules. The dashed line shows the boundary between the crystalline and non-crystalline regions as predicted by the SVM algorithm using RBF kernel.
The figure shows that non-crystalline molecules are concentrated in a region with an RBC of 4–7 and a 0χv value of 12–17, while the crystalline molecules mostly occupy a slightly more spread out region of both lower RBC and lower 0χv. The line obtained from the SVM algorithm shows how it uses this fact to distinguish between the majority of crystalline and non-crystalline molecules, confirming the discriminatory importance of these two descriptors. There is significant overlap between the classes at the centre of the graph  . It is in these cases where more descriptors are necessary to improve the predictive accuracy of the calculation (up to 90.3% using all 177 descriptors).
What are the conclusions?
The authors conclude that this approach can be used to train an algorithm to predict with 90.3% accuracy whether a molecule may have a propensity to form crystals. Experimental testing of these predictions validated the use of the ZINC-CSD intersection as the crystalline dataset and ZINC as the non-crystalline dataset once CSD molecules are removed.
What are the next steps?
The authors plan to test the predictions for guiding synthetic modifications of molecules in order to control crystallinity. They intend to develop and test new crystallisation descriptors introducing three-dimensional information to improve the classification accuracy of the model. They are also carrying out further experimental validation of the model using a larger test subset of up to 200 materials.
Additional information from the authors...
'For a crystallographer interested in molecular structure, the biggest barrier to studying materials is obtaining them in a crystalline form.
Machine learning approaches have been applied to predict many properties of molecules – we set out to test whether there was sufficient information in a conventional 2D chemical diagram (atom types and bonds) to predict whether a material would crystallize easily.
“Big data” approach, rather than test thousands of compounds: Cambridge Database contains examples of things that are crystalline – we use commercially available catalogues to construct a complementary data set of things that are not crystalline.
This analysis tells us when a material should crystallize – and therefore when to expend effort trying to obtain crystalline sample. For some applications it also tells us how small changes to a molecule might make it more, or less, crystalline.
To assess the predictive power of the model, the accuracy is checked on a separate set of unseen data. Additionally we carried out a small blind-test recrystallisation in the lab using materials that we had predicted to be either crystalline or non-crystalline.
Complementary to CSP
The model inputs are simple facts about each molecule that can be computed from the 2D diagram, such as number and types of atoms, counts of chemical groups present, and connectivity indices. We have attempted to reverse engineer the model (by training it with only a few properties of the molecule) to find out which input facts are most significant. It turns out that just a couple of values for each molecule will still produce a working model that is about 80% accurate – in the paper, we show that rotatable bond count (how flexible is the molecule) and Chi0V (an indirect 2D measure of 3D molecular volume) taken together provide the best accuracy.
Volume can be related to the ease with which a solvated molecule can move from solution to the solid-state, and the more flexible a molecule is, the lower the concentration of the particular conformation which is needed to attach to a crystal surface.
We are currently studying a range of materials that we consider to be on the edge of crystallinity, with a view to gaining more insight into the mechanisms inhibiting their growth into larger crystals.
There are many things that the model doesn’t know about, that we would like to incorporate, but currently don’t have the source data for - principally temperature and solvent.'
The authors

Jerome G. P. Wicker
Jerome Wicker received an M.Chem. from the University of Oxford in 2013 and is currently a second year D.Phil. candidate in Inorganic Chemistry at Oxford, supervised by Professor R. Cooper. His current research interests include the application of big-data approaches to development of predictive models for crystallisation.

Richard I. Cooper
Richard Cooper studied Chemistry at Oxford and obtained a DPhil in Inorganic Chemistry in 2000 under the supervision of Dr David Watkin. Following several academic and industrial posts, he is currently Head of Chemical Crystallography and Associate Professor in the University of Oxford’s Chemistry Department. His research interests lie in the development of crystallographic structure analysis techniques and knowledge-based computational predictions of the properties of materials.
References
1. Lommerse JPM, Motherwell WD, Ammon HL, et al. A test of crystal structure prediction of small organic molecules. Acta Crystallogr B. 2000;56(4):697–714. doi:10.1107/S0108768100004584.
2. Motherwell WDS, Ammon HL, Dunitz JD, et al. Crystal structure prediction of small organic molecules: a second blind test. Acta Crystallogr B. 2002;58(4):647–661. doi:10.1107/S0108768102005669.
3. Day GM, Motherwell WDS, Ammon HL, et al. A third blind test of crystal structure prediction. Acta Crystallogr B. 2005;61(5):511–27. doi:10.1107/S0108768105016563.
4. Day GM, Cooper TG, Cruz-Cabeza AJ, et al. Significant progress in predicting the crystal structures of small organic molecules - a report on the fourth blind test. Acta Crystallogr B. 2009;65(Pt 2):107–25. doi:10.1107/S0108768109004066.
5. Bardwell DA, Adjiman CS, Arnautova YA, et al. Towards crystal structure prediction of complex organic compounds - a report on the fifth blind test. Acta Crystallogr B. 2011;67(Pt 6):535–51. doi:10.1107/S0108768111042868.
6. Pan Y, Jiang J, Wang R, Cao H, Cui Y. A novel QSPR model for prediction of lower flammability limits of organic compounds based on support vector machine. J Hazard Mater. 2009;168:962–9. doi:10.1016/j.jhazmat.2009.02.122.
7. Louis B, Singh J, Shaik B, Agrawal VK, Khadikar P V. QSPR study on the estimation of solubility of drug-like organic compounds: a case of barbiturates. Chem Biol Drug Des. 2009;74(2):190–5. doi:10.1111/j.1747-0285.2009.00844.x.
8. Xue CX, Zhang RS, Liu HX, Liu MC, Hu ZD, Fan BT. Support vector machines-based quantitative structure-property relationship for the prediction of heat capacity. J Chem Inf Comp Sci. 2004;44(4):1267–74. doi:10.1021/ci049934n.
9. Varnek A, Kireeva N, Tetko I V, Baskin II, Solov’ev VP. Exhaustive QSPR studies of a large diverse set of ionic liquids: how accurately can we predict melting points? J Chem Inf Model. 2007;47(3):1111–22. doi:10.1021/ci600493x.
10. Rupp B, Wang J. Predictive models for protein crystallization. Methods. 2004;34(3):390–407. doi:10.1016/j.ymeth.2004.03.031.
11. Irwin JJ, Shoichet BK. ZINC - a free database of commercially available compounds for virtual screening. J Chem Inf Model. 2005;45(1):177–82. doi:10.1021/ci049714+.
12. Allen FH. The Cambridge Structural Database: a quarter of a million crystal structures and rising. Acta Crystallogr B. 2002;58(3):380–388. doi:10.1107/S0108768102003890.
13. Lipinski CA, Lombardo F, Dominy BW, Feeney PJ. Experimental and computational approaches to estimate solubility and permeability in drug discovery and development settings. Adv Drug Deliv Rev. 1997;23(1-3):3–25.
14. Lipinski CA. Lead- and drug-like compounds: the rule-of-five revolution. Drug Discov Today Technol. 2004;1(4):337–341. doi:10.1016/j.ddtec.2004.11.007.
15. Landrum G. RDKit: Open-source cheminformatics. Available at: http://www.rdkit.org/.
16. Kier L. Molecular Connectivity In Chemistry And Drug Research.; 1977:50–60.
Additional information
Journal articles made easy are journal articles from a range of Royal Society of Chemistry journals that have been re-written into a standard, accessible format. They contain links to the associated Chemistry World article, ChemSpider entries, related journal articles, books and Learn Chemistry resources such as videos of techniques, and resources on theory and activities. They should facilitate students understanding of scientific journal articles and how to extract and interpret the information in them.
No comments yet