


Prepare for a career in industry or business after your chemistry degree using this self-study resource for undergraduates
As a chemist, you can already bring a lot to the world of business, from your subject knowledge and technical training to your experience of research and analysis. But if you want to pursue a career in industry or commerce, what should you know about marketing, intellectual property or finance? And what skills are essential for working in business?
This self-study resource is designed to help you develop the skills and understanding you need to thrive in a commercial role. Whether you’re passionate about working as a chemist in a specialised industry context, or want to explore opportunities in business outside chemistry, use this resource to:
- Improve your knowledge of finance, regulations, intellectual property and quality assurance
- Explore the marketing ‘mix’ and learn how to create an effective strategy
- Gain insight into startups, spinouts and how new businesses plan for growth
- Identify and develop key business skills, from productivity and planning to communication and creativity
Practise and apply what you learn through exercises based on a variety of business scenarios and real life case studies, and discover tips to help you further develop your skills and experience alongside your degree.
What’s on this page
- Using this resource
- From university to business: tips and suggestions
- What do chemists do in business and industry?
- What business skills do I need?
- Money and finance
- Ideas and intellectual property
- Regulations
- Quality assurance and control
- Marketing
- Startups and spinouts
- Practice scenarios
- Notes for tutors
1. Using this resource
Business Skills and Commercial Awareness for Chemists is designed to help you develop the skills and understanding you need to pursue a career in business or industry. You will explore things it’s useful to know about business (commercial awareness) and things it’s important to be able to do effectively (business skills).
Read on to find out how to get the most out of this resource, or explore some chemistry-related industries to start thinking about roles and sectors that might interest you.
1.1. What topics can I learn about?
To help you develop your commercial awareness, the materials cover six key topics relevant to many different roles and commercial contexts, including:
- Money and finance
- Ideas and intellectual property
- Regulations
- Quality assurance and control
- Marketing
- Startups and spinouts
Each topic has a general introduction and links to selected resources to read more widely about the issues. There are also a number of video contributions from people working in industry, offering personal perspectives on what it helps to know about business early in your career.
Using presentations in this resource
Some topics feature downloadable Powerpoint presentations. Each presentation is accompanied by a guide which explains the material and provides instructions on how to navigate the slideshow. You will need to start the presentation (in Powerpoint, click ‘Start from Beginning’ or press F5) and continue to click when prompted by the guide (‘click 1’ means ‘click for the first time’, ‘click 2’ means ‘click for the second time’ and so on).
1.2. How can I practise and apply what I learn?
When it comes to business skills, practice is essential. This resource includes a range of activities designed to help you apply what you learn and practise key skills.
Try short exercises linked to individual topics, or for a greater challenge explore the four scenarios available for download. Each scenario puts you in the position of justifying a significant business decision. It is the way you make this decision that provides the opportunity to reflect on and develop your business skills.
Launching lemon bleach
For each topic, you will find at least one exercise that relates to an imagined business opportunity surrounding ‘lemon bleach’. This is intended to mimic a situation where a discovery you have made lends itself to potential commercialisation. In this case, you have identified some unique fragrance ingredients that offer the possibility of a new range of distinctive household cleaning products.
As you work through each of the business topics, you will build up a more complete picture of all the things you would have to engage with if you wanted to launch lemon bleach as a product, including:
- Calculating costs
- Trademark design
- Searching for patents
- IP protections
- Complying with regulations
- Developing quality control procedures
- Preparing a marketing strategy
At this stage, you would be in a position to produce a business plan, especially if you had explored the links and guidance on producing effective business plans in the Startups and spinouts section. In fact, producing such a business plan is a major outcome of each of the four practice scenarios, and drawing together the component strands of the lemon bleach business opportunity forms one of these.
Download the guidance notes for the lemon bleach scenario now, or explore the other practice scenarios included in this resource.
2. From university to business: tips and suggestions
The materials in this resource are designed to give you an overview of commercial awareness and key business skills. You can build on what you learn here by following industry news, taking advantage of support available at your institution and, where possible, seeking opportunities to do part-time or voluntary work.
2.1. Building a skills plan
Higher education can offer significant opportunities to supplement the business skills and awareness you begin to acquire here. Many institutions provide a range of courses and seminars on communication, teamwork, and even more business-specific topics such as finance and enterprise.
- Explore your institution’s website and write down a list of the courses, seminars and workshops available to you that will reinforce your business skills.
- Think about the wider opportunities available to you (part-time jobs, volunteering, business competitions etc) that might give you the chance to develop your business skills and commercial awareness. Write down a list.
- List all the courses, activities, hobbies and employment you have already completed that have helped you gain useful skills for business or develop your awareness of the topics covered by this resource.
- Plan your next steps by prioritising the options available to you. Rank the courses, activities and opportunities you have identified in order of priority and set timeframes and SMART goals for each of them.
Explore industry and business news with Chemistry World
Whether you’re interested in pharmaceuticals, technology or food, follow chemistry-related business news and analysis with Chemistry World online.
Registration is quick and completely free.
3. What do chemists do in business and industry?
Chemists find roles in a wide range of business environments, much wider than traditional destinations such as the heavy chemical industry, petrochemicals and pharmaceuticals. The range of sizes of business spans everything from organisations with teams of chemists to others where there might be a single qualified chemist. In this section, you will explore the past, present and future of chemistry-related industries, and find out more about what you could do as a professional chemist.
Discover a future in chemistry
You can find further information and support, including career ideas, case studies and job profiles, at the Royal Society of Chemistry’s careers website, A Future in Chemistry.
3.1. The history of the chemical industry
In the 19th and 20th centuries, the chemical industry developed rapidly in response to the attendant social needs of industrial revolution, population growth and shifts in geo-political and economic pre-eminence. Technological developments generally proceeded in advance of detailed scientific understanding, perhaps in contrast to modern and future chemical industry developments where fundamental scientific breakthroughs are creating new business opportunities.
Find out more
- David J. Rowe’s survey of the history of the chemical industry from 1750 to 1930 links the emergence of the chemical industry in Britain with key political, social and scientific developments.
- For an alternative, more global perspective, try Johann Peter Murmann’s comprehensive article on the chemical industries after 1850.
Exercises
- Using Rowe’s article, list examples of technologies that have been exploited commercially long before the fundamental science underpinning them has been understood. List examples of businesses that have followed on directly from fundamental scientific discoveries. Search the internet to put dates against the technologies involved. Is it true to say that the trend is now increasingly for scientific discovery (research) to precede commercial development?
- Search the internet for more information on the history of the chemical industry. Make notes on the key developments that you find.
Further reading
- A. Heaton, An Introduction to Industrial Chemistry, Blackie, Glasgow, 1996.
- A. Heaton, The Chemical Industry, Blackie, Glasgow, 1996.
- The Essential Chemical Industry, CIEC, University of York, 2013.
3.2. The chemical industry today
The chemical industry continues to evolve while facing important challenges, from declining supplies of raw materials to increasing environmental sensitivity and the impact of global climate change. The following resources provide more information about the chemical industry today.
Find out more
The European Chemical Industry Council (CEFIC) publishes a variety of reports and resources on the relative size, scope and composition of the European chemical industry, as well as providing information on sustainability initiatives. For example:
- The 2023 Facts and Figures of the European chemical industry report compares the European chemical industry to the rest of the world and includes information about market share, industry production and contributions to other EU industries.
- The 2020 CEFIC Sustainability Progress Update reflects on the chemical industry’s ongoing role in transitioning to ‘a safe, resource efficient, circular, low-carbon society’.
ICIS, a chemical market information supplier, publish an annual list of the Top 100 chemical companies in the world, together with a general overview of the current state of the chemical industry. (You can download reports like the Mid-year Global Review and H2 Trends by registering for free on the ICIS website.)
Exercise
Explore some of the companies in the Top 100 to see what their speciality is and what makes them successful. You could also check their careers sections to get an idea of which specialist skills are in demand.
3.3. Choosing a career in chemistry
Professionals formally trained in chemistry-related disciplines can be found in different walks of life in terms of industry sectors, eg from flavour and fragrance to waste management, and in terms of positions, eg a lab scientist or an editor. You can find examples of chemistry graduate careers and job roles on the University of Warwick and University of York websites.
You may already have a specific chemistry career in mind but, even so, it is still instructive to take a look at what kinds of things chemists currently do. If you’re less certain about your immediate future, try exploring some of the job profiles from the RSC’s A Future in Chemistry, or take a look at the American Chemical Society’s College to Career resources.
You may also wish to refer to your own university’s Careers/Employability facilities for more information about careers in science, whether you want to gather more information on a particular career or explore what is available to you.
Exercises
- Write down a list of chemistry industry careers that particularly appeal to you. Write down what you think each role entails then search the internet and see if the information you find confirms your expectations.
- How long have the roles you wrote down existed within the industry? What historical factors have caused the roles to evolve into their current form?
3.4. The future of chemistry-related industries
The chemical industry is dynamic and forecasting future trends is no easy task. However, such predictions are vital for industry professionals, investors and policy makers, not least where training and education of the future workforce is concerned.
Find out more
KPMG are a tax and auditing firm who produce detailed forecast reports on many different market sectors, including the chemical industry. Explore their reports and resources on the chemicals sector to get an idea of the challenges the industry will face over the next few years, and how they will affect the state of the chemical market and its individual players.
Exercises
- In the previous section, you wrote down a list of chemical industry careers that appeal to you. What current and impending factors do you think are impacting on those roles? (You may need to search the internet to find more about key issues affecting the industry.)
- If you are already working within the industry, on placement for example, what are the key issues affecting the future of the business of your host company?
4. What business skills do I need?
As a student, you’re probably familiar with lists of key personal, transferable and study skills. However, when you hear the phrase ‘business skills’, a different combination of expertise and competencies might come to mind.
You might think ‘business skills’ are the skills you need to run a business. For some people, this might have more to do with accounting and financing or an in-depth knowledge of the stock market, while for others it might mean the know-how required for marketing and selling products. The more pessimistic among us might even think it means having a natural entrepreneurial talent that can’t be taught or learned.
If you’re a chemistry student planning to work in a lab in academia or industry, you might feel you don’t have much use for these mystical business skills anyway. But it’s hard to make a judgment on the usefulness of business skills without defining them first.
4.1. What are ‘business skills’?
If you’re struggling to define what business skills are, you’re not alone. Whilst all are agreed that employees with good business skills are essential to the effective running of a business, different people have quite varying views concerning just what exactly they consist of.
If you search online for what business skills are, you’re likely to come across some or all of the skills in the table below, which seem to resonate with the views of most people.
| Communication | Planning |
|
Written communication Social networking Speaking Sales Negotiation |
Strategic planning Project management Financial planning Risk management Logic |
| Productivity | Creativity |
|
Time management Meeting coordination Systems skills Leadership Personal productivity |
Imagination Inventiveness Problem solving Brainstorming Making connections |
4.2. What skills do chemistry graduates find most useful?
The skills we’ve just listed are consistent with the type of language used by management and industry, but they are still fairly close to those found on most transferable skills lists.
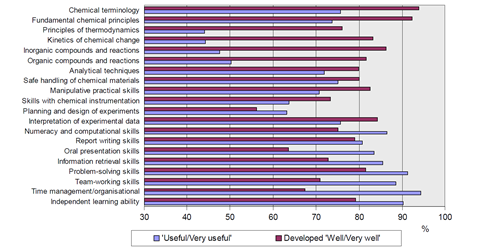
The strong overlap between transferable skills and what might be identified as business skills was reinforced by the 2010 survey, ’Skills Required by New Chemistry Graduates and Their Development in Degree Programmes’, conducted by the Higher Education Academy with the support of the Royal Society of Chemistry.
This report also showed that the majority of chemistry graduates found these transferable/business skills were more important, and less developed, than their in-depth knowledge of chemistry when they started their careers in chemistry or other industry. In fact, they rated these skills as more important that an in-depth knowledge of chemical terminology, and even analytical techniques.
4.3. What skills do businesses value?
We asked some representatives from chemistry-related businesses to tell us what skills they found made the most employable graduate chemists, and which skills are essential as opposed to beneficial. The relevant business skills as identified by the respondents are shown in the table below.
| Communication | Interpersonal skills |
|
Networking and communication skills Teamwork Effective written communication (email, summarising results) |
Cultural awareness Working with and motivating people with different personality types Working effectively with people from diverse backgrounds and organisations |
| Productivity and planning | Creativity |
|
Influencing and leadership Managing people Research planning Time management |
Making connections Effective problem definition Flexibility |
Some interesting ‘skills’, which are more related to commercial awareness of the chemical industry, were also flagged as very important by the same respondents, with some more specialised than others. In addition to general business awareness, these ‘skills’ included knowing about:
- Basic finance
- Company funding
- Legilsation and economics
- How clinical trials are funded
- The development and application of intellectual property
- The structure, function and implications of patents
- Knowledge of state-of-the-art technologies
This demonstrates how difficult it can be to distinguish clearly between generic transferable skills and knowledge of the inner workings of the industry, because a good industrial chemist should be well developed in both areas. Although the need for transferable skills is no different from any other sector, the uniqueness of the chemical industry, and therefore the situations in which these skills will come in handy, require a good understanding of the whole industry.
Hear from industry experts
Exercise
In Choosing a career in chemistry, you wrote down a list of chemical industry careers that appeal to you. Which areas of skills and business awareness do you think are most important in each of those roles? How do you rate your current skills and awareness in these areas at present?
5. Money and finance
Just as there are carbon and nitrogen cycles in nature, there is a cycle of money in any business or organization. Knowing how this cycle works and maintaining a ‘healthy’ flow of money within it will ensure the long-term success of the business, and delivery of projects on time and within budget.
This topic aims to give you a basic understanding of how to keep track of finances – ie incomings and outgoings – and the most widely used tools to accomplish this.
5.1. Micro- and macro-economics
Economics was defined by Lioniel Robbins in 1932 as ‘a science which studies human behaviour as a relation between ends and scarce means which have alternative uses’.
Throughout this topic, you will cover key concepts within the field of market economics and the management of financial resources within an organisation. This is known as ’micro-economics’, as opposed to ‘macro-economics’, which covers more general industry-wide, national and international issues.
While this resource focuses on micro-economics, we encourage you to read widely about economics in general and its particular relationship with the chemical industry.
Suggested reading
- W. F. Samuelson and S. G. Marks, Managerial Economics, Wiley, 2014.
- W. B. Allen, K. Weigelt, N. A. Doherty and E. Mansfield, Managerial Economics, Norton, New York, 2012.
- D. Gowland and A. Paterson, Microeconomic Analysis, Haverster Wheatsheaf, London, 1993.
- A. Heaton, An Introduction to Industrial Chemistry, Blackie, Glasgow, 1996.
- A. Heaton, The Chemical Industry, Blackie, Glasgow, 1996.
5.2. Hear from industry experts
5.3. Cost centres
It is very important for an organisation to control its costs and in order to do this it must collect and manage as much cost information as possible. Financial management systems are usually set up around ‘cost centres’.
The Institute of Chartered Management Accountants defines a cost centre as ‘a location, function or item of equipment in respect of which costs may be ascertained and related to units costs’. A cost unit is defined as ‘a quantitative unit of product or service in relation to which costs are ascertained’.
A hierarchy of cost centres is often used to gather costs in an increasing level of detail.
Exercises
- Browse the internet using the key words ‘cost centre’, ‘cost unit’ and ‘cost management systems’ and make your own notes on what you find.
- Make a list of possible cost centres within an organisation you are familiar with, for example your employer, your educational establishment or your charity. Link the possible cost centres into a hierarchical tree, with the whole organisation at the top and the smallest appropriate, manageable, cost units at the bottom.
5.4. Cost types
Within the chemical and other process industries in particular it is helpful to categorise costs in two main ways.
Variable and fixed costs
One approach to categorising costs is to express them as either ‘variable’ or ‘fixed’.
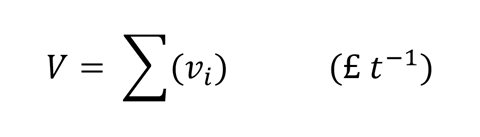
A variable cost is a cost item that is related to the quantity of product manufactured and is expressed in units of money per amount eg £t -1 (where t is a metric tonne or 1000 kg). Examples of variable costs are raw materials, solvents, homogeneous catalysts, energy and water.
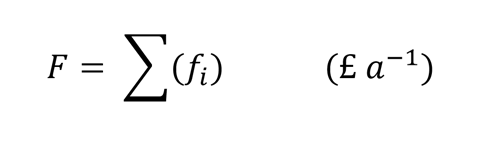
A fixed cost is a cost item that is not related to the quantity of product manufactured and which has to paid in full at the start or during production and is expressed in units of money per time period eg £ a -1 (where a is per annum or year). Examples of fixed costs are labour charges, administrative overheads, central R&D expenditure.
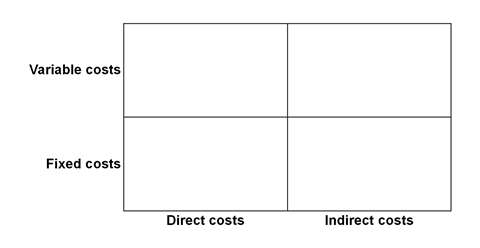
Direct and indirect costs
Another way to categorise costs is to express them as either ‘direct’ or ‘indirect’.
A direct cost is an item that is incurred specifically to manufacture the product, such as raw materials, production equipment and labour charges.
An indirect cost is an item incurred not specifically for the product in question but elsewhere within the company, such as central management or the human resources department.
Exercises
- Browse using the key words, ‘variable cost’, ‘fixed cost’, ‘direct cost’ and ‘indirect cost’ and make some notes on what you find.
- These two approaches to categorising cost types may be linked within a 2 x 2 matrix, as shown below. Populate the four matrix boxes with as many different examples of cost items as you can suggest.
5.5. Cost equations
When the individual costs of a business have been identified and categorised into fixed or variable they can be added together and used to prepare cost equations. A cost equation shows the relationship between the costs and the quantity of product manufactured.
Let the quantity of product manufactured be x, which will be expressed in units of amount per time period eg tonne/annum. If each fixed cost is represented by f i (where i is 1 to the total number of fixed cost items) then the total fixed cost F will be:
If each variable cost is represented by v i (wherei is 1 to the total number of variable cost items) then the total variable costs will be:
The fixed and variable costs may be combined to derive cost equations.
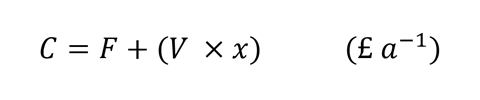
Total cost (C) equation
A total cost equation is the sum of all costs associated with manufacturing the product:
Average cost (AC) equation
An average total cost equation is the total cost of manufacture divided by the quantity manufactured:
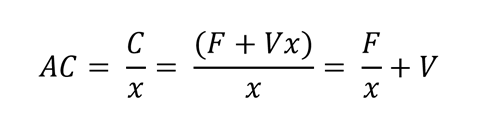
In other words, average total cost = average fixed cost + average variable cost.
Marginal cost (MC) equation
A marginal cost is the cost of producing one extra unit of product than is currently produced. For example if 10 units cost a total of £100 to manufacture and 11 cost a total of £105 to manufacture then the marginal cost of producing the 11th unit is £5.
Marginal cost is the small change in cost for a small change of quantity manufactured at a given point along the total equation, hence may be defined algebraically as:
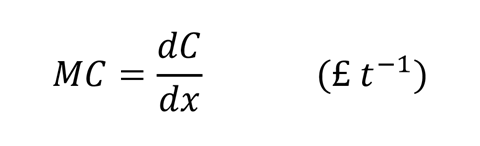
In other words, the marginal cost equation is obtained by differentiating the total cost equation.
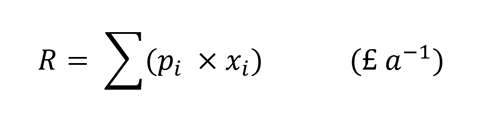
5.6. Revenue equations
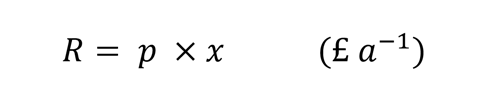
After the products are manufactured they will be sold into a market at a price per unit p. The total amount of money received is termed the revenue R. If the price of each product item is represented by pi (where i is 1 to the total number of product items sold x) then the total revenue R will be the price multiplied by the quantity:
The price and quantity of products sold may be used to prepare total revenue and marginal revenue equations.
Total revenue (R) equation
A total revenue equation shows the relationship between the revenue and the quantity of product manufactured:
Marginal revenue (MR) equation
A marginal revenue is the extra money received from selling one extra unit of product than is currently sold. For example if 10 units are sold for a total of £100 and 11 units sold for a total of £105 then the marginal revenue of selling the 11th unit is £5.
Marginal revenue is the small change in revenue for a small change in quantity sold at a given point along the revenue equation, hence may be defined algebraically as:
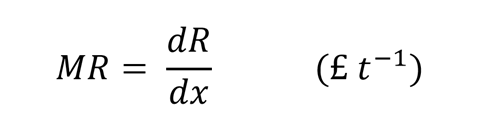
In other words, the marginal revenue equation is obtained by differentiating the revenue equation.
5.7. Profit equations
The profit P is defined as the difference between the revenue and the costs for manufacturing a product. A number of different profit measures may be determined, including full profit and gross margin.
Full profit (P) equation
The full profit equation is the total revenue minus the total costs:
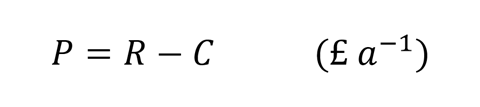
A company will aim to maximise the profit for a given product by maximising the revenue and minimising the costs.
Gross margin (GM) equation
A profit measure used extensively within the chemical industry is gross margin, which is defined as the total revenue minus the variable costs:

The gross margin will allow the profitability of the production plant to be judged without the involvement of central overhead fixed costs. Central overheads are usually allocated to a production cost centre by the main company hence beyond the control of the local production manager. A production manager that maximises the gross margin of the product will maximise the amount of money that can be contributed towards company fixed overheads.
Exercises
- Browse the internet using the key words, ‘total cost equation’, ‘average cost equation’, ‘marginal cost equation’, ‘marginal revenue equation’, ‘profit’ and ‘gross margin’. Make you own notes on what you find.
- Suggest as many different reasons as you can why an organisation would want to maximise profit.
- The best way to learn about cost equations is to practise using them. Download this cost equation example worksheet to attempt to derive a cost equation for a process.
- As you will be aware, the scale of production can have a dramatic effect on the unit cost of a product. Explore the linear cost equation description of this observation for a Friedel–Crafts alkylation process in this worksheet.
- Some cost calculations are less straightforward, such as where the capacity of chemical plant influences the cost of an operation leading to non-linear cost equations. Try this non-linear cost equation worksheet to practise working with these more complex calculations.
5.8. Demand and supply
When a company offers a product for sale into the marketplace many factors will influence the quantity of the product that will be sold. The demand for a product in a given market may be defined as ‘the quantity q of a good or service that will be bought at a specific price p in a given period of time’.
The relationship between the quantity and price is termed the ‘demand function’.
Exercise
Make a list of as many different parameters as you can think of that will have an influence on the quantity of a product that will be demanded by customers in a market.
Demand equation
We can generate a demand equation relating the price and quantity of a product in a given market. However, this can only be done by offering the product for sale into the market at various prices and recording the quantity sold. In this way, a demand schedule may be built up and the demand equation determined.
An example of a demand schedule is shown in the table below.
| Selling price (£ kg-1) | Quantity sold (kg) |
|---|---|
| 10 | 0.0 |
| 9 | 0.7 |
| 8 | 1.5 |
| 7 | 2.4 |
| 6 | 3.4 |
| 5 | 4.6 |
| 4 | 6.1 |
| 3 | 8.5 |
| 2 | 13 |
| 1 | 19 |
The demand schedule shows that if the product is offered for sale at £9 kg-1 only 0.7 kg will be sold whereas if it is offered for sale at £2 kg-1 then 13 kg will be sold.
A graph of price against quantity may be plotted as shown below and the equation of this curve is the demand equation.
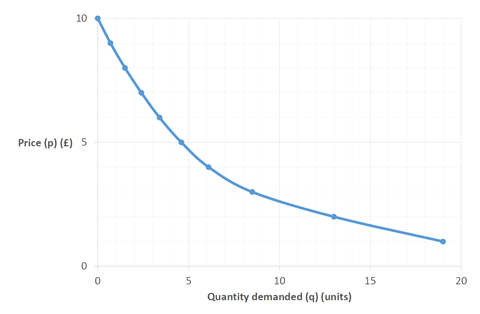
The general features of a demand equation are that it is a downwardly sloping curve – ie it has a negative gradient – and that there is an upper price limit.
Exercises
- Browse the internet using the key words ‘demand function’ and ‘demand schedule’ and make your own notes on what you find.
- Try this simple activity to explore demand schedules further.
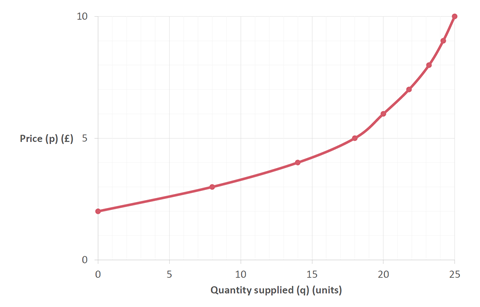
Supply equation
Complementary to the demand function is the supply function. The supply function is defined as ‘the quantity q of a good or service that will be offered for sale at a specific price p in a given period of time’.
Exercise
Make a list of as many different parameters as you can think of that will have an influence on the quantity of a product that will be supplied by a company into a marketplace.
An example of a supply schedule is shown in table below.
| Selling price (£ kg-1) | Quantity prepared to be sold by manufacturers (kg) |
|---|---|
| 10 | 25 |
| 9 | 24.2 |
| 8 | 23.2 |
| 7 | 21.8 |
| 6 | 20 |
| 5 | 18 |
| 4 | 14 |
| 3 | 8 |
| 2 | 0 |
| 1 | 0 |
The higher the price in the market the more product will be supplied by manufacturers because it is more profitable. Hence a supply function is always an upwardly sloping curve, as in the graph below, with a threshold price below which all manufacturers would make a loss so they will not supply product.
Exercise
Browse the internet using the key word ‘supply function’ and make your own notes on what you find.
5.9. How much product should an individual company supply to a market?
This is an interesting question and may be answered by a consideration of the cost equations for each manufacturer. Download this presentation on market supply to find out more, using the guide below.
Presentation guide
Start the presentation and click when prompted (see Using presentations in this resource).
- Every manufacturer will have their own unique cost structure hence their own average cost (AC) and marginal cost (MC) equations (see Cost equations).
- If the price of the product in the market is p1 then the demand equation faced by the company will be flat and constant at p1 (see Perfect markets) (click 1). The demand equation will also be the same as the marginal revenue equation (see Perfect markets).
- The company will wish to maximise profit by operating at the position where MC = MR (see Cost equations) so will supply a quantity q1 at the price p1 (click 2).
- If the price in the market changes to p2 then to maximise profit the company will supply quantity q2 (click 3).
- If the price in the market changes to p3 then to maximise profit the company will supply quantity q3 (click 4).
- If the price in the market changes to p4 then to maximise profit the company will supply quantity q4 (click 5).
- If the price in the market changes to p5 then to maximise profit the company will supply quantity q5 (click 6). However, this maximum profit is actually a minimum loss because the costs are above the revenue so in order to not make a loss the company will stop supplying product at any quantity below that of the minimum of the average cost curve.
- In conclusion, the supply curve for the company will be the same curve and same algebraic equation as the average cost AC curve at all quantity levels above that of the minimum of the AC curve (click 7).
- A similar analysis will apply to every company in the market and each company will have their own individual supply curve. Note that the quantity supplied by an individual company is given the letterx while the quantity supplied in a whole market is given the letter q. These are related by the number of companies n supplying the market.
- A market supply curve is obtained by adding together individual supply curves in a process of ‘horizontal summation’ (click 8).
5.10. Perfect markets
A perfect market model is similar in concept to the perfect gas equation: many assumptions are made and the model has limited use in practice. However, the features of a perfect market model are often shown within markets and the analysis can be useful as a guide.
The main assumptions made within a perfect market model are:
- The product sold is homogeneous, ie all participants sell to an identical specification.
- All participants aim to maximise their profits.
- There is a large (infinite) number of buyers and sellers within the perfect marketplace.
- Every participant has perfect knowledge about the product, ie its production and use.
- There are no barriers for participants to enter or leave the perfect marketplace, eg financial, production capacity, patent protection.
- The quantity of product sold by an individual company into the perfect market is very small compared to the total market size.
- There is no economic friction, ie import barriers, government trade restrictions.
Exercise
Make a list of products or services you think are close to a perfect market scenario. Browse the internet to identify possible examples.
5.11. Perfect market analysis
Download this Powerpoint presentation to find out more about using perfect market models, referring to the guide below to follow the analysis.
Presentation guide
Start the presentation and click when prompted (see Using presentations in this resource).
- Begin with a blank graph of price p against quantity q. Note the quantity in the whole market is defined as q.
- Within a perfect market there will be a demand curve set by the behaviour of the customers. The market demand curve will be a downwardly sloping curve (click 1).
- The supply curve will be a horizontally summation of the supply curves for each of the many small producers in the perfect market. The market supply curve will be an upwardly sloping curve (click 2).
- The intersection of the demand and supply curves will represent the optimum price and quantity within the perfect market and is termed the ‘equilibrium price’ (click 3) and ‘equilibrium quantity’ (click 4).
- The equilibrium price and quantity will change rapidly in response to changes in the market. If the demand curve increases from D1 to D2 then the equilibrium position will change to E2 (click 5). If the supply curve then decreases from S1 to S2 then the equilibrium position will change to E3 (click 6).
- So the prices and quantities will be determined by market forces and individual companies will be ‘price takers’, in other words they will have to accept the price set by the market (click 7).
Exercise
Search the internet using the key words ‘perfect market model’ and ‘price takers’. Make your own notes on what you find.
5.12. Analysis for individual companies within a perfect market
Download and open this presentation on perfect market pricing and use the guide below to learn how to analyse individual companies within a perfect market model.
Presentation guide
Start the presentation and click when prompted (see Using presentations in this resource).
- Each company in the perfect market is assumed to have a similar cost structure, as shown in the graph of the average cost curve and the marginal cost curve.
- Assuming the equilibrium price in the perfect market is p1 then because each company is a price taker they will be faced with a demand curve of constant price whatever amount they manufacture (click 1).
- A constant demand curve will mean that the marginal revenue curve is also constant and identical (click 2). Can you prove this algebraically starting with a demand equation of p = q, then forming a revenue equation, then determining a marginal revenue equation?
- The profit maximisation point for the individual company will be at the position MC = MR and therefore this will be the quantity q1. The company will make a profit as this price is above the average costs (click 3).
- If the price then drops to p2 in the market the MC =MR position will move to price p2 and quantity toq2 and the company will break even as now the price = average costs (click 4).
- If the price then drops to p3 in the market the MC = MR position will move to price p3 and quantity to q3 and the company will be making a loss, hence the company will withdraw from the perfect market (click 5). However as companies withdraw because the product is not profitable then the overall market supply will decrease hence the market equilibrium price will increase, which will encourage companies to enter the market again.
- Therefore the perfect market will be in a constant state of flux as demand and supply curves change and companies enter and withdraw from the market.
Exercise
Test your understanding by working through this worksheet on calculations relating to a perfect market model.
5.13. Monopoly markets
There are many reasons why a perfect market structure will tend not to exist in practice, such as:
- Some companies will operate a larger production plant hence will have economies of scale and a lower cost basis.
- Not all products will be identical, some will have a slightly higher specification or be branded.
- Supply and demand may not be regular.
- Customers will often behave irrationally.
- Not all firms in a market aim to maximise profit exclusively due to their aims or culture.
- Knowledge of a product or its applications is not costless.
- Collaboration or collusion (often illegal) exists between producers and customers.
One example of an imperfect market is a monopoly. In this market structure the following assumptions are made:
- There is a single supplier, although in practice a market with a dominant player (above 25% market share) will often exhibit monopolistic tendencies.
- There is one, homogeneous product and no substitutes are available.
- The product is sold at a single price.
- The supplier aims to maximise profit.
- The demand function is still valid, as a single supplier cannot force a customer to buy the product.
A monopoly market structure is considered anti-competitive in most countries and legislation is in place to control or limit the negative effects.
5.14. Monopoly market analysis
Download this Powerpoint presentation and use the guide below to explore the analysis of a monopoly market.
Presentation guide
Start the presentation and click when prompted (see Using presentations in this resource).
- The starting point of this analysis is a graph of the cost curves facing one of the many companies in a perfect market (see Perfect markets) (opening slide). The graph shows the marginal cost curve for the company and as it will be price taker (in a perfect market) it will face a constant demand curve at price p1. The marginal revenue MR curve is identical to the demand curve. Hence the profit maximisation position is where MC = MR at quantity q1 (click 1).
- However, if this company was to build a large scale production plant and manufacture sufficient product to supply the whole market it would be able to dictate the price and quantity available in the market. Hence the company would become a monopolist and a ‘price setter’ and would be faced with the whole market demand which is a downwardly sloping curve (see Demand and supply) (click 2).
- In this situation the marginal revenue MR curve is not now identical to the demand curve as it will show a steeper gradient (click 3). You can demonstrate this by starting with a demand curve represented by the equation p = 5 – 2q, rather than a perfect market constant price demand equation of p = 5. Now determine the revenue R equation which is obtained by multiplying price by quantity, where the price is now given by the demand equation. You should derive an equation for the revenue as a function of q. Now determine the marginal revenue MR equation by differentiating the revenue equation (dR/ dq), to obtain MR = 5 – 4q, ie a similar curve to the demand equation but with a steeper gradient.
- In this monopoly situation the company will want to maximise its profits by operating at MC = MR, which is now at quantity q2 (click 4). Therefore once a monopoly has been formed the monopolist will probably want to maximise profit by raising the price to the customers (and accordingly will have to lower the quantity supplied to match the demand curve), which of course is bad news for the customers.
- The position q3 is the location of maximum revenue for the company, can you prove this algebraically? (click 5). (Hint: how can you determine the maximum or minimum point of a curve using calculus?)
- The monopoly situation is repeated on the next slide (click 6). However, because the company has built a very large manufacturing plant to cover the whole market it will be able to take advantage of economies of scale hence will experience lower unit costs. Therefore its marginal cost curve will be lower than it would be for a small producer in a perfect market (click 7). The position of profit maximisation MC = MR (click 8) will now be at quantityq4 hence at price p4 (click 9). This situation is termed a ‘natural monopoly’ (click 10) and will result in a lower price (and accordingly higher quantity supplied to match the demand curve) for the customers, which of course is good news for the customers.
- Due to the large amount of money needed to build and operate a chemical plant it makes good sense for all concerned to build larger plants to take advantage of economies of scale rather than build many small plants. Therefore the chemical industry in particular has a tendency to form a natural monopoly, at least localised within countries or regions.
Exercises
- Browse the internet using the key words ‘natural monopoly’. Make your own notes on what you find.
- Consider the advantages and disadvantages of allowing a monopoly to exist within an industry. Perhaps conduct a debate with a group of colleagues with one taking the stance that a monopoly is good and the other taking the stance that a monopoly is bad. As part of this exercise, gather background information on the legislation in force concerning a monopoly. Consult the pages on the UK government website covering the Competition and Markets Authority, and consider the role of patents (see Ideas and intellectual property).
- Check your understanding by working through this worksheet on calculations within a monopoly market scenario.
5.15. Oligopoly markets
Another example of an imperfect market is an oligopoly. An oligopoly may be defined as ‘a market in which a few firms dominate by virtue of being the major suppliers of a commodity for which there are no substitutes’.
In this market structure analysis the following assumptions are made:
- There are only two, equally-sized, suppliers, although in practice a market with a few dominant players (above 35% market share) will often exhibit oligopolistic tendencies.
- There is one, homogeneous product and no substitutes are available.
- Both suppliers aim to maximise profit.
An oligopolistic style of market is often found with the bulk chemical industry.
Exercise
Browse the internet using the key word ‘oligopoly market model’. Make your own notes on what you find.
5.16. Oligopoly market analysis
Download this presentation on oligopoly markets and use the guide below to explore about their analysis.
Presentation guide
Start the presentation and click when prompted (see Using presentations in this resource).
- The starting point of this analysis is a graph of the cost curves facing one of the many companies in a perfect market (see Perfect markets). The graph shows the marginal cost curve for the company and as it will be price taker (in a perfect market) it will face a constant demand curve at price p1. The marginal revenue MR curve is identical to the demand curve.
- However, in this oligopoly analysis there are only two main suppliers, call them company A and company B. Each of these companies may not be ‘price setters’ as in a monopoly but will have a big influence on the price of the product in the market and the price set by each other.
- Consider the demand curve for company A’s product. This will be influenced by the price of company B’s product.
- In one scenario assume that company A always charges the same price as company B, in which case the demand curve D1 will be downwardly sloping (click 1), although currently the price has not changed at p1.
- In another scenario assume that company B will always charge price p1 whatever price company A charges, in which case the demand curve will be D2 (click 2). This is because if company A lowers its price but company B keeps a higher price then company A will sell more product and the demand will be higher. However, if company A raises its price but company B keeps a lower price then company A will sell less product and the demand will be lower.
- Each demand curve D1 and D2 will be associated with different marginal revenue curves MR1 and MR2 respectively (click 3).
- Assume that whatever price is charged by company A it will always assume the worst, ie that company B will always follow a price cut but not a price rise. In which case the demand curve facing company A will be kinked (click 4) because for all prices below p1 curve D2 will be followed but for all prices above p1 curve D1 will be followed. Consequently there will be a stepped marginal revenue curve (click 5) as below p1 MR2 will be followed and above p1 MR1 will be followed.
- An identical analysis for the demand and marginal revenue curve facing company B will apply.
- The consequence of the kinked demand curve and stepped marginal revenue curve can be seen when the profit maximisation point at MC = MR is determined. Marginal cost curve MC1 intersects the stepped marginal revenue curve within the disjuncture (click 6). The profit maximising price is p1 and quantityq1. Marginal cost curve MC2 also intersects the stepped marginal revenue curve within the disjuncture (click 7), hence the profit maximising price is also p1 and quantity alsoq1.
- So there can be a wide fluctuation in the marginal costs and the profit maximising price and quantity will remain at p1 and q1. Within an oligopoly market once this price and quantity become stabilised then they can remain constant over long periods of time as the costs fluctuate. If the marginal costs change significantly such that the MC curve intersects the stepped MR curve away from the disjuncture then there may be a flurry of price changes until after a while the price stabilises again at a new price level within a different MR step.
Exercises
- Make a list of markets you judge are oligopolies or oligopolistic in style, search the internet to help you identify some examples, especially within the chemical and pharmaceutical fields.
- Test your understanding of the oligopoly market model by working through the calculations on this worksheet.
5.17. The cartel market model
The word ‘cartel’ is derived from the German/Dutch ‘Kartel’ meaning company associations. A cartel may be defined as ‘all sellers of a homogeneous good in a market are members of a trade association which fixes a common price for the good’.
Exercise
Browse the internet using the key words ‘cartel market’. Make your own notes on what you find.
A cartel is an illegal market practice in most countries and severe penalties may be awarded to those found guilty of operating a cartel. However, the potential financial rewards for participants are high, which makes this practice very tempting to follow.
5.18. Cartel market analysis
Download this Powerpoint presentation to learn about the behaviour and analysis of cartel markets, using the accompanying guide below.
Presentation guide
Start the presentation and click when prompted (see Using presentations in this resource).
- The starting point of this analysis is a graph of the demand and supply curves for a whole perfect market (see Perfect markets). The graph shows the downwardly sloping demand curve and upwardly sloping supply curve (consisting of a horizontal summation of individual companies marginal cost curves). The equilibrium price is at p1 and the equilibrium quantity is at q1.
- The lower graph shows the marginal cost curve for an individual company and as it will be a price taker in a perfect market it will face a constant demand curve at price p1 (click 1). The marginal revenue MR curve is identical to the demand curve. Hence the profit maximisation position for an individual company is where MC = MR at quantity x1 (click 2).
- Companies operating in this market may look at these two graphs and realise that if they could work together (as a cartel) and set a common price for the product, without worrying that the competition will undercut with lower prices, then they could be an effective Monopoly. If this was the case then instead of being individual ‘price takers’ the companies within the cartel could become ‘price setters’ and operate around the whole market demand curve, which will have a associated marginal revenue MR curve and a profit maximisation at price p2 and market quantity q2 (click 3). In other words, every member of the cartel would obtain a higher price for their product. There is a strong economic incentive to set up a cartel to the detriment of customers who will have to pay a higher price for their product.
- However, the cartel will have limited control over the demand curve, which is determined by the response of customers. Therefore in order to keep the demand equation in balance the cartel as a whole must supply the market quantityq2. The only way of doing this is if the cartel members get together, not just to set a common price, but also to share out the available quantity to supply between them. Once they have done this each company will then be expected to supply its quota of product into the market.
- Assume that one company within the cartel is allocated a quantity x2 to supply. For them they are now faced with an individual demand curve D2 and supplying quantity x2 at a set price of p2 (click 4). In other words they are now a price taker, albeit at the common higher cartel price to which they have agreed.
- However, this individual cartel member would like to maximise its profits by setting MC = MR, which is at price p2 and quantity x3, which is a higher quantity than x2 (click 5). Hence this company faces a dilemma, to supply the lower quantity agreed with its fellow cartel members or to supply the higher quantity to maximise its own profits. The cartel agreement will only work economically if the overall market supply is kept at q2. So the individual company has a big financial incentive to cheat on the cartel and sell more that agreed.
- An individual company may get away with cheating on the cartel if no one else finds out and the extra quantity sold is not large in relation to the whole market. However, the consequences of being found out usually means that the cartel will disintegrate, all price agreements are now void and the market returns to a competitive perfect situation with lower prices.
- However, once the competitive market has returned there is now a financial incentive to re-form the cartel and the cycle can start again of forming and breaking up.
- As cartels are an illegal trading practice there are many reasons why a cartel will break up, including one member whistle blowing on the others.
Exercise
Search the internet to find as many examples of chemical and pharmaceutical companies who have been investigated or proven to be involved with operating a cartel. Find answers to the following two questions:
- What legal penalties may be applied to a company and company staff found guilty of operating a cartel?
- What often happens to whistle blowers from within a cartel?
5.19. Accounting and finance
Financial management and control is important because:
- Companies must operate profitably.
- Failure to control expenditure or to ensure adequate income could render the company insolvent.
- In order to operate effectively financial targets must be set.
- There is a legal requirement to comply with accepted accountancy conventions and systems.
- Directors have an overall responsibility to their shareholders for the financially sound operation of the company and must publish an Annual Report and be subject to the scrutiny of external and internal auditors.
- Shareholders are the owners of the company.
- They elect a Board of Directors to run the company.
- They approve the strategic plans which the directors propose.
- Directors issue an Annual Company Report and give an account of their performance at the Annual General Meeting of Shareholders.
- Shareholders may receive dividends on their shares from distributed profits and may have a capital gain in the market value of their share increases but they can also have losses from selling their shares.
- Shareholders can initiate the liquidation of the company and receive back the nominal value of their shares or whatever is left after short-term or long-term creditors have been paid.
- Thus in the end the Shareholders have financial control over a company but it is the Directors and Managers who are responsible to the shareholders for executing the necessary financial management and control of the detailed company affairs.
Annual Reports have to be published by all limited companies as required by the Companies Act.
Company Accounts should contain the following sections:
- Directors’ Report
- Balance Sheet
- Profit and Loss Account
- Cash Flow Statement
- Notes on the Accounts
- Auditor’s Report
Some useful accounting terms
- Share capital – the permanent capital of the business comprises ordinary shares (equity) and preference shares
- Reserves – composed of retained profits, long-term liabilities of bank loans, mortgages and debentures
- Current liabilities – due for payment within one year and composed of short-term bank loans, current tax, trade creditors and the liability to pay current dividend
- Fixed assets – permanent assets used to provide good and services including properties, fixtures and equipment
- Current assets – have an expected tie span on no more than one year including cash and material that can be readily converted into cash eg stocks and trade debtors
- Depreciation a provision made as a charge on profits for the value of a fixed asset, if depreciation is not charged to the accounts then profits will be reported too highly and the net book value of fixed assets will be too high
Hear from a management accountant
Exercises
- Watch this video on the language of business, which provides a good background to accounting and finance.
- Watch this series of video lectures on the principles of accounting and make notes on each of the main topics (you can explore further lectures if you wish):
- Watch this video series from ORU, covering a course in accounting principles:
- Browse the accounting tutorials on SimpleStudies and make your own notes on what you find.
5.20. What is a profit and loss account?
A profit and loss account (or statement) summarises the revenue and expenses of the business for an accounting period. It shows tax charged against profit and the extent to which after-tax profits are paid back as dividends (distributed) or retained in the business (ploughed back).
Example: Acme Chemicals
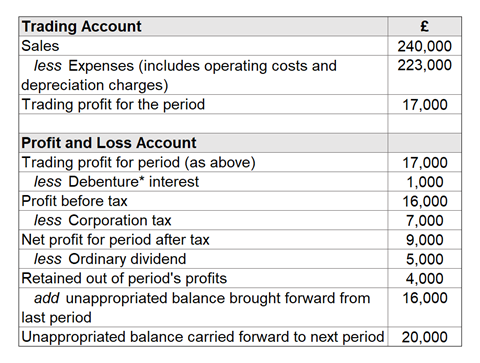
* ‘Debenture’ is a form of company debt, a bond bearing a fixed rate of interest payable whether the company makes a profit or not.
Exercise
Watch this video about a profit and loss account. Make your own notes on what you find.
5.21. What is a balance sheet?
A balance sheet is a classified summary as at a particular date showing the sources of funds controlled by a business and how it has used these funds.
Example: Acme Chemicals
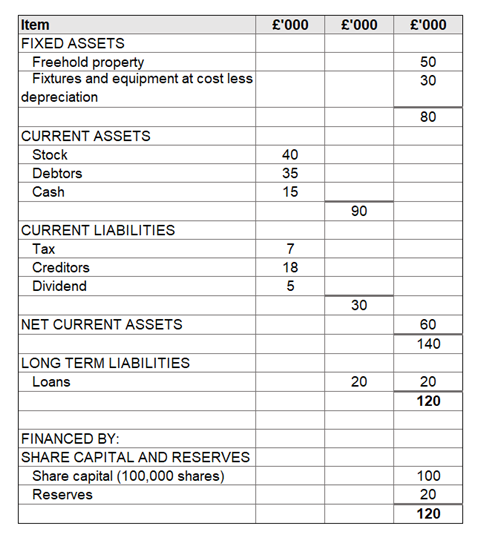
Note that the value of the net assets of the company (£120,000) is balanced by how they have been financed (£100,000 from shareholders and £20,000 from previous company profits).
Exercise
Explore the following resources about balance sheets and make your own notes on what you find:
- What is a balance sheet? (video)
- Profit and loss account and balance sheet (video)
- How to prepare a balance sheet (tutorial)
- A balance sheet example (video)
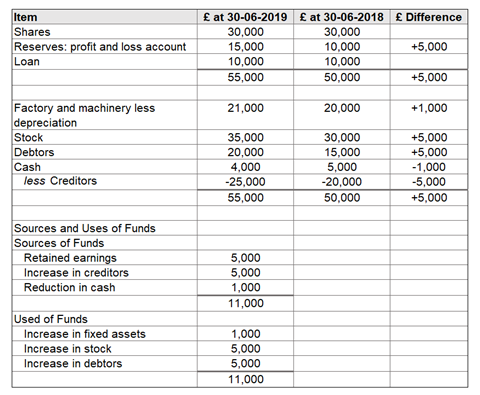
5.22. What is a cash flow statement?
A cash flow statement shows the major changes in the accounting period in the funds which a company controls.
Example: Ebor Chemicals
Exercises
- Watch the following videos about cash flow statements and make your own notes on what you find:
- Browse the corporate websites of chemical and pharmaceutical companies and find their latest Annual Reports. Locate their balance sheet, profit and loss account and cash flow statements and try to identify the items listed above in the examples. Are they profitable? Have they issued shares or taken out a large bank loan recently in order to finance a major investment or takeover of another company?
5.23. Analysing company accounts
There are several different accounting methods for analysing a company’s financial statements, including vertical analysis, horizontal analysis and ratio analysis.
Vertical analysis
In this method, all figures in the accounts are converted to percentages of the relevant total or sub-total to aid comparison and perspective.
Horizontal analysis
This compares performance between years and between companies. It helps managers to determine which financial components are out of line.
It is important to compare like with like.
Ratio analysis
This compares figures from different sections of the accounts. It involves calculating financial ratios, looking for trends in these ratios and comparing them with average values for other companies in the same industry. The following ratios are commonly used:
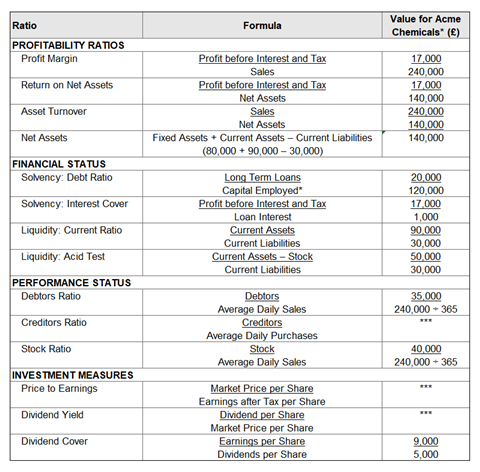
*Capital employed = Share capital + Loans = 100,000 + 20,000 = 120,000
Exercise
Review this topic and find out more with this series of video talks on finance and accounting by entrepreneur Lisa Newton.
5.24. Corporate finance
Corporate finance is about how an organisation raises finance to support its activities and how it manages the money raised effectively and efficiently.
Finance is available from many sources:
- Shareholders in the form of share capital (company pays dividends)
- Banks and other financial institutions in the form of loans, short and long-term (company pays interest)
- Investors in the form of corporate bonds (company pays back the capital on an agreed date as stated in the bond and interest throughout the lifetime of the bond)
- Governments in the form of grants and tax reliefs
- Wealthy individuals
- Retained profits from exiting business operations (for commercial organisations)
- Charitable donations (for charity/educational organisations)
Exercise
Explore the following videos and make notes on what you find:
- Finance: what managers need to know (Harvard Business Review)
- Overview of finance (Lipscomb University)
- Introduction to corporate finance (LSBF Global MBA)
5.25. Financial appraisal of projects
An important role for a manager within the chemical industry is to decide between different project options. An important factor to take into account when making these decisions is the financial aspects and to identify which project will return the most money for the company over the life time of the project.
There are many financial appraisal tools that can be used to help make these decisions and two are introduced here, payback period and discounted cash flow. In all cases it is necessary to predict future incomes and costs and profits for the project options, which is a risky but necessary activity (see Forecasting business trends).
Exercise
Watch this video on investment appraisal methods for an overview of financial appraisal.
5.26. Payback period
The payback period has been widely used within the chemical industry and is basically how long it will take for the expected net cash inflows of a project to pay back the net investment outlays.
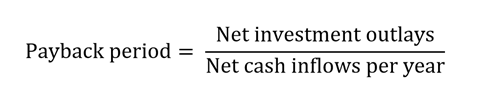
The decision is to select the project with the shortest payback period.
Example 1
A chemical company is considering the acquisition of automated drum filling equipment which will reduce labour costs. The following facts have been estimated:
- Net investment outlays: £200,000
- Estimated annual cash savings (after tax): £60,000
- Estimated useful life: 5 years
- Salvage value: nil
Payback period = £200,000 / £60,000 = 3.33 years
Example 2
A chemical company is considering four different investment projects each costing £20,000. Which project should be chosen?
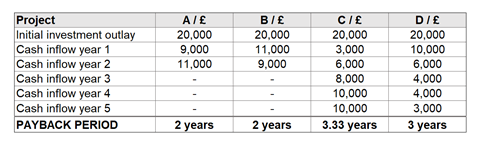
Project A and B have the shortest payback period so should be selected by the company. However, on detailed inspection it is noticed that whilst project C has the longest payback period it actually returns the most cash over five years as can be seen in the graph below.
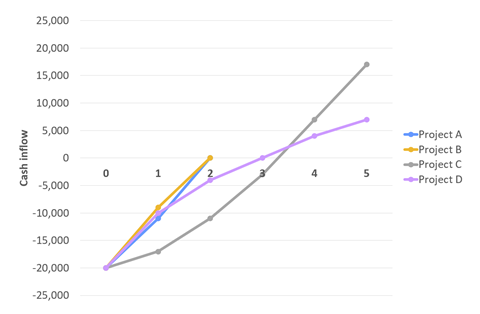
This illustrates the disadvantage of using payback period in that cash flows which are returned after the payback period are not counted.
Advantages of payback period
- Simple to calculate
- Easy to understand
- Good comparison for projects of equal duration and similar complexity
Disadvantages of payback period
- Ignores all cash flows after the payback period
- Does not take risk into account therefore will often select a risky fast payback project over a safe slower project.
- Ignores the time value of money (see the next section on discounted cash flow below)
Exercise
Browse the internet using ‘payback period’. Make your own notes on what you find.
5.27. Discounted cash flow
Discount cash flow is a widely used technique to determine the financial feasibility of a long-term project, such as the building of a chemical plant.
Forecasting techniques may be used to predict the incomes and costs of the products manufactured. However, one problem with a long-term project is concerned with the time value money.
Basically, if you have £1000 in your pocket today and you leave it there then it will still be worth £1000 in a years time. But if you invest the £1000 in a bank at 10% interest then after a year you will have £1100 and after two years you will have £1210.
So time erodes the value of money and the compound interest formulae can be used to calculate how much money will be worth in the future at a given rate of interest.
Exercises
- Download this presentation on discounted cash flow to find out more about key related topics, including the time value of money, net present value (NPV) and internal rate of return (IRR).
- Browse the internet using the terms ‘discount cash flow’, ‘net present value’ and ‘internal rate of return’. Make your own notes on what you find.
- Watch the following videos on discount cash flow:
The project with the highest positive NPV is the project that should be selected from a financial point of view. A positive NPV means that the project will return more cash than would be the case if the investment was put into a bank at the discount rate of interest.
Advantages of discount cash flow
- Includes the time value of money
- Clear choice criteria
- An absolute measure
Disadvantages of discount cash flow
- Complex to calculate (although easy by computer) and difficult to forecast data far in the future
- Difficult to relate to the financial accounts because only cash items should be considered within a DCF whereas accounts contain non-cash items such as depreciation
Exercise
Watch the following video lectures from RCA Belfast summarising investment appraisal techniques:
5.28. Summary exercises
Demand and supply curves calculation
Download this worksheet to practise calculations relating to demand and supply, drawing together material from Cost equations and Perfect markets.
Launching lemon bleach: calculating costs
In this exercise, you will use published cost information from catalogues and other sources to build up a cost estimate for an aliphatic nitrile fragrance component, based on the process chemistry described in the associated patent literature.
Find out more about the lemon bleach scenario used in this resource, or download the costing exercise now.
6. Ideas and intellectual property
Intellectual property (IP) is like the centre of a solar system, around which many aspects of business revolve, especially in the chemical industry.
IP is usually the result of a substantial investment in R&D over many years. With appropriate protection, IP can ensure returns on that investment, and that the business remains profitable.
This section gives an overview of the various types of IP, with a particular emphasis on patents, and how IP is managed. Chemists working on new products in R&D liaise with lawyers to maximize protection of the intellectual property they create, and it is crucial for them to understand each other.
6.1. Hear from a patent attorney
6.2. Types of intellectual property
Everywhere around you there are commercial goods that have different characteristics and are either functionally or visually different, while some of them merely have different brand names.
In most cases, there is something special about these goods that made you purchase it, and it is most likely that the manufacturer has protected this special feature to distinguish their products from competitors and thus gain economic advantage.
Knowing what types of IP protection are available to a company and their specifications can help to protect new development in its early stage, target product development to maximize IP protection, or to ensure that a new development does not infringe on other companies’ IP, which could result in lost investment and lawsuit charges.
Find out more
Read about trademarks, copyright and designs – three of the four main types of IP – on the website of the Intellectual Property Office, the UK’s official government body responsible for granting IP rights.
The primary and most rewarding form of protection applicable to the chemical industry is patent protection, explored in the next section.
The type of IP protection you need depends on what you’ve created and what you’ll use it for. Some products need all four!
The Intellectual Property Office
Exercise
Now that you know about different types of IP protection, do you think it is always beneficial to protect your idea or keep it as a trade secret? Explain your reasoning.
Launching lemon bleach: trademark design
You are aiming to launch a new range of household cleaners based on distinctive new bleach-stable aliphatic nitrile citrus fragrance components that you have been able to produce. Design a trademark for your ‘lemon bleach’ product line.
Find out more about the lemon bleach scenario used in this resource.
6.3. Patents: searching, reading and applying
Patents in the chemical industry are the most applicable and valuable form of IP protection that deters competitors and secures returns on the capital invested in R&D, which tends to be very costly, especially in the pharmaceutical industry. For academia, patents can be also a stable source of income to continue funding research, or could result in successful spinouts.
Before its benefit can be fully exploited, a patent needs to be applied for and granted. Given the purpose of the patent system, one should expect the procedure to be complicated, lengthy and costly. However, thorough understanding of the patenting procedure can help reduce the time and cost of the procedure and increase the benefits.
For this reason, your knowledge of the patent system can give you a competitive advantage as a job candidate, as well as to your employing company, where R&D ideas rely on patenting protection.
Find out more
The first and most important step in a patent application is to make sure that no one else has patented the same idea before, ie study the prior art. The main way to do this is to check existing patents in your area. Use this presentation on patent searching to find out where to look and how to search effectively.
Now, find any patent and try reading it. What do you think? Is it easy to read it? It is good to be able to read patents, and although they can seem confusing at first, there is a general structure to patents that makes it easier. Download this presentation identifying the key features of patents to learn how to read them.
Knowing how to read a patent will also help with drafting your own patent, since all patents conform to the same general structure. Last but not least, you need to be familiar with the patent application procedure of the region you wish your patent to be active in, since the procedure depends on the patent authority in your jurisdiction (although the variations are not major). This step-by-step patent guide from the UK government provides an overview of the patent process.
Launching lemon bleach: checking for patents
You have produced a range of distinctive citrus fragrance components for a new variety of bleach. The structures are shown below:
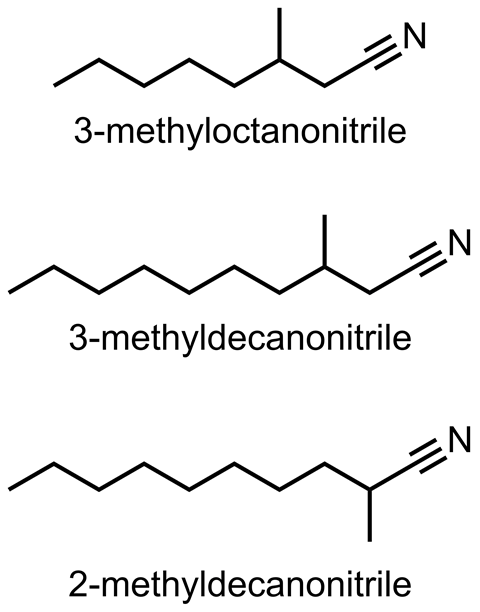
Search for patents relating to these molecules. What protection has been, or is, in place? Are there patents relating to production routes that might affect your intended manufacture? Is there any precedent in the patent literature for the use of these molecules in cleaning products?
6.4. Intellectual property management
Patent is property, like a house. And like with a house, there are a number of ways you could deal with it:
- Move in yourself (use your patent to provide commercial product)
- Rent it out to an individual (licence your patent for other company with technical capabilities to exploit your patent)
- Hire a property managing company to take care of it (hire a contractor company to manufacture your patented product with your full rights to the patent intact)
- Refurbish it into flats and rent it out to a number of individuals (licence your invention to a number of companies and collect fees from each of them)
The best option depends on the circumstances of the individual inventor. However, one thing is clear: deciding in favour of inaction is unwise, and a waste of money. Since there are a number of possibilities, what is the right or wrong decision is not clear cut.
Find out more
Read Ashish Arora’s article ‘Patents, licensing and market structure in the chemical industry’, in which the author gives a historical overview of patents, their role in global chemical development and how licensing and trade secrets shaped the industry.
6.5. Summary exercises
Launching lemon bleach: IP protections
In Types of intellectual property, you met the idea of designing a trademark for a ‘lemon bleach’ household cleaning product line, and you should have explored the IP landscape surrounding the fragrance chemicals you plan on using in Patents: searching, reading and applying.
In addition to your trademark, provide details of the full range of protection you could put in place for your product range (and covering the range of activity from production of the fragrance to marketing of the product range). In view of the processes and costs involved, which protection would you actually recommend putting in place?
Reflections of a patent/trademark attorney
The background of fragrance chemistry provides an interesting perspective on patents and trademarks. Patent/trademark attorney Tony McStea began life as a graduate chemist in the patent division at Dulux Australia (paints) before moving through ICI and various divisions of European chemical giants Novartis and BASF to the leading flavour and fragrance company Givaudan.
Read McStea’s reflections on patents and trademarks to find out more.
7. Regulations
The chemical industry is one of the leaders across the world in terms of generated revenue, extent of trade and number of jobs. For over a century it has helped to shape the modern world, and it has an important role to play in addressing a number of the challenges we face today, from depleting natural resources to maintaining the health of a growing and aging population.
It is crucial that the chemical industry approaches these challenges with the health and safety of the public and its workforce as a priority, while also preserving the natural environment. These priorities govern the legislative framework that the industry operates in.
This section gives an overview of the regulations to which the chemical industry must adhere, focusing on the EU and the UK.
7.1. Hear from an industry expert
7.2. International regulations
The chemical industry is one of the most heavily regulated industries. The regulatory framework governing it has undergone drastic changes in recent years for a number of reasons: to protect human health and the environment by addressing emerging toxicity data, and to improve the sustainability of the industry to address shortage of resources and climate change.
The history of the chemical industry has also seen a number of devastating accidents that led to stringent rules and regulations to prevent these and similar incidents from happening again. With improving understanding of the harm chemicals can cause, changing manufacturing methods and growing demand due to emerging economies, regulations in the chemical industry are continuously changing.
In order for businesses to stay successful and profitable, they not only have to comply with current rules and regulations, but should also monitor trends to prepare for future changes. Most of the existing laws and regulations are the result of the evolving legislative framework over decades and decades of the industry’s history. However, there is a multi-level hierarchy of rules set and followed by different bodies.
Throughout this section on regulations, this hierarchy is broken down to three levels:
- The international level, ie the UN
- The regional level, ie the EU
- The national level, ie the UK
We will cover how these different levels of regulation influence operations of a business that manufactures or handles chemicals.
Find out more
On the international level, there are global problems that need to be addressed by all of the nations in order to tackle them effectively. That is why many countries decide to come together to reach agreements and to set up initiatives that are mostly very ambitious, far reaching and to a large extent cannot be immediately implemented.
However, these initiatives can set up a course of movement for the governments and the industry, thus influencing changes to the regulatory framework in the future.
Search the internet to familiarise yourself with some of the international agreements and initiatives that have shaped the chemical industry in recent decades, including the Marrakech Process, the Basel Convention, the Rotterdam Convention and the Strategic Approach to International Chemicals Management (SAICM).
You may also be able to find relevant information on the European Chemical Industry Council (CEFIC) website.
7.3. Regional regulations
In the previous section, you learned about the existence of international initiatives for regulating the chemical industry, and familiarized yourself with some of the initiatives and conventions. The next level of the regulational hierarchy that will be discussed here is almost completely unique to the EU.
The EU decides on the directives that all member states should incorporate into their national legislative frameworks. Nowhere else in the world does such a large group of developed countries have to commit to a uniform legislative and economic framework for their chemical industries.
The main goal of this system is to enable trade and facilitate safety. It must be said that, to date, EU regulation of the chemical industry is the most demanding globally, with the greatest priority given to the safety of the consumer and the environment.
Registration, Evaluation, Authorisation and Restriction of Chemicals (REACH)
REACH is the EU’s contribution to the UN initiative, Strategic Approach to International Chemicals Management (SAICM), and with its introduction, the EU set the global pace for change in chemical legislation to promote the safe and responsible use of chemicals.
In Europe, the Registration, Evaluation and Authorization and Restriction of Chemicals (REACH) regulation entered into force on the 1st of June 2007. This legislation replaces the patchwork of many different directives and regulations which has developed historically and puts in place a comprehensive system for chemicals control in Europe.
CEFIC
The impact of REACH is not limited to the EU, since every non-EU trader and manufacturer wishing to sell products containing chemicals on the EU market – one of the biggest markets in the world – has to comply with the regulations. The official body within the EU which controls and enforces REACH is the European Chemical Agency (ECHA), and you can find more information about the REACH legislation on their website.
Classification, Labelling and Packaging (CLP)
The ECHA also controls implementation of Classification, Labelling and Packaging regulation (CLP) which is the EU commitment to implement the UN Globally Harmonised System of Classification and Labelling of Chemicals (GHS).
The Environmental Protection Agency (EPA)
Another powerful regional authority in the chemical industry is the Environmental Protection Agency (EPA) in the US, which could also be classified as a regional regulatory authority since it has power to enforce regulations in all states. After the introduction of REACH in the EU, the EPA initiated a similar harmonized system to keep up with the EU’s changing structure.
Case study: the pharmaceutical industry
Legislation within the pharmaceutical industry requires a special mention. The pharmaceutical industry is a unique sector of the chemical industry, where novel and complex chemical products are intended for internal use in humans.
The safety of the consumer in this case needs to be ensured especially thoroughly, since the main property of a drug is its biological activity. Therefore, this sector of the chemical industry requires a separate legislative framework and dedicated authoritative bodies to ensure appropriate control.
In the EU, the European Medicines Agency (EMA) ensures the safety of consumers of medicinal products. In the US, the Food and Drug Administration (FDA) has a similar role, and its control stretches worldwide: the FDA has exclusive authority to approve new drugs and diagnostic tools.
The safety of consumers of medicines is ensured through rigorous pre-clinical development, which commonly involves animal testing and clinical trials on human volunteers. The ethical issues of animal testing have been long acknowledged and although alternatives are sought after no reliable tool has been found yet.
These vigorous testing requirements are the reason for the incredibly high costs of R&D within the sector: the industry’s estimates suggest that the cost of bringing a new pharmaceutical to the market could be as high as US$1.7 billion and on average takes 8 years. Considering the length and the cost of development, all scientists involved in the development need to be aware of all of the steps required for a drug to be approved and brought to the market.
Find out more about the process of drug development and FDA approval.
Exercise
The Drug reprofiling practice scenario provides a specific activity that explores legislation relating to the pharmaceutical industry.
7.4. National regulations
In the UK, employers’, consumers’ and environmental health and safety are covered by the actions of two governmental authorities: the Health and Safety Executive (HSE) and the Environment Agency (EA).
The HSE’s job is to prevent people being killed, injured or made ill by their work, regardless of the nature of the work and the industry. However, since hazards are high and common in the chemical industry, special attention is paid to safety in the chemical sector, or any other sector which uses chemicals in the UK. Explore the HSE’s information and guidance on chemicals to find out more.
The EA has a closer connection to the chemical industry in the UK since it is the only authority able to authorise or prohibit the use of chemicals. It also monitors environmental emissions from chemical plants and collects environmental data from the chemical industry.
Exercise
What legislation and laws does your chemistry department (and/or your placement company if you are currently on an industrial placement) have to comply with while purchasing, handling and disposing of chemicals? Ask around and make a list. Try to identify whether the law concerning chemicals in a university differs from the chemical industry.
7.5. Launching lemon bleach: complying with regulations
As you have gathered from the information presented in this section and the various resources that you have been directed to, the legislative demands made of the chemical industry are extremely varied and difficult to achieve, making compliance extremely challenging, although absolutely necessary.
One of the biggest challenges is deciding what level of detail is required. To a large extent, this is governed by the nature of the chemical you are producing, but will also determined by the market into which you are selling the chemical product.
Bearing in mind the information above and from previous sections, you should consider different approaches to taking forward the application of the nitrile family of bleach-stable fragrance components in the ‘lemon bleach’ scenario:
- Chemical preparation of these molecules on a <1 tonne scale as intermediates for selling on to a chemical/formulation company for incorporation into a finished product.
- Chemical preparation of these molecules on a >1 tonne scale as intermediates for selling on to a chemical/formulation company for incorporation into a finished product.
- Chemical preparation of these molecules and in-house formulation of a final finished product for selling to the public.
- Licensing of this technology to a chemical intermediate supplier (possibly in a BRIC country) for production of the intermediate.
Each of the above options will have particular legislative issues associated with it (particular reference should be made to REACH regulations) and this will inform the strategic decision of the company as to how to take these forward.
You should prepare a brief overview of the legislation landscape for each of these options (around 1–2 pages) that could be incorporated into making a business case for development.
8. Quality assurance and control
Quality is an incredibly important issue for chemical products, especially those which are intended for direct use by humans, such as pharmaceuticals, cosmetics and food. The tools of quality assurance and quality control enable manufacturers to provide consistent products which satisfy the needs of consumers and the requirements of regulations.
This section introduces you to a selection of topics within the field of quality management, quality assurance and statistical process control, which are of vital importance to the profitability and safe running of a chemical business.
8.1. Hear from an industry expert
8.2. Defining quality
The British Standards Institute and American Society of Quality have defined quality as ‘the totality of features and characteristics of a product or service that bears on its ability to satisfy stated or implied needs’.
Exercise
Search the internet for ‘definitions of quality’. Make your own notes on what you find.
A common theme that runs through definitions of quality is the concept of meeting the requirements or specifications of customers. Hence a product with a high specification, for example a solvent with >99.5% purity for use in high performance analysis or with a low specification of 95% purity for general laboratory use, can be equally high quality products if they meet customer expectations.
Exercises
- Read this resource on definitions of quality by Victor Sower (Sam Houston State University, SHSU) and make your own notes on what you find.
- Explore other online materials from the Quality Assurance Management course at SHSU.
Further reading
- G. B. Wetherill and W. B. Brown, Statistical process control: theory and practice, Chapman and Hall, London, 1991.
- A. J. Duncan, Quality control and industrial statistics, Irwin Homewood, Illinois, 1986.
- J. R. Thompson and J. Koronacki, Statistical process control for quality improvement, Chapman and Hall, London, 1993.
8.3. The quality ‘gurus’
A number of individuals (the quality ‘gurus’) have been very influential in the development of quality techniques over the last 60 years. Three of these individuals, W. Edwards Deming, Joseph Juran and Philip Crosby are introduced below.
William (W.) Edwards Deming
Listen to Edwards Deming discuss his ideas about quality in the following videos, and make your own notes on what you find:
See also W. Edwards Deming, Out of the crisis, MIT Press, Cambridge, 1986.
Joseph M. Juran
Watch the videos below to find out about the ideas of Joseph M. Juran and make notes on the key points and themes of his approach:
- Juran’s Pareto principle
- Root cause analysis from Juran
- Interview with Joseph M. Juran (1998)
- Quality guru Joseph Juran
See also J. M. Juran, Quality control handbook, McGraw-Hill, New York, 1951 (10th edition, 2010).
Philip Crosby
Listen to the ideas of Philip Crosby and make your own notes on what you learn.
See also P. B. Crosby, Quality is free, McGraw-Hill, New York, 1979.
Exercise
- Using your notes, compare and contrast the ideas of Deming, Juran and Crosby. Can you identify any common ground? Try to write down the key characteristics of each approach.
- Compare what you have written with the lists of themes below.
Themes from Deming
- Importance of senior management commitment
- Statistical approach to quality control
- Continuous improvement
- Delighting the customer
Themes from Juran
- Importance of senior management commitment
- Problem solving techniques / remedial action
- Emphasis on managerial action rather than individual and attitude changes
- Annual improvement
Themes from Crosby
- Importance of senior management commitment
- Education programme aimed at individual
- Simple problem solving techniques
- Attitude changes
- Common quality vocabulary
Common themes
Whilst each approach emphasises different aspects of quality, the common themes are senior management commitment and continual improvement.
8.4. Quality assurance systems
The ideas on quality publicised by visionaries such as Deming, Juran and Crosby have been developed into functional quality management systems.
In 1979, the British Standards Institute developed the BS5750 quality system standard. Organisations could set up management procedures to ensure the standard was met, submit to outside auditing and be awarded BS5750 registration, which they could use on their company advertising literature. Quality system registration showed to customers that the organisation followed quality assurance principles and procedures, hence their product or service would always deliver according to the agreed specification.
The British standard has now been superseded by the world standard from the International Standards Organisation (ISO), ISO9000.
Exercises
- Consult ISO’s guide to quality management principles for background information on ISO9000 quality assurance systems. Make notes on what you learn.
- Read the following sections from this related ISO documentation (referring to ISO9001*) to find out more about the design and implementation of quality management systems in the context of ISO9000:
- Introduction > 0.1 General
- Introduction > 0.2 Process approach
- Note the range of topics addressed by each section of the ISO documentation in exercise 2, covering all aspects of an organisation’s operations (eg ‘Product realisation’, including ‘Design and development’).
- Watch this video introduction to the ISO9001* standard, showing examples of organisations implementing ISO9000 quality assurance.
- Is your organisation ISO9000 registered? If so, ask your colleagues how the above 8 sections of the ISO9000 standard are managed within your organisation. Do you consider that there is senior management commitment and support for continual improvement?
* Learn about the relationship between ISO9000 and ISO9001 on the American Society for Quality (ASQ) website.
8.5. Statistical process control
Statistical process control (SPC) may be defined as a means of identifying the sources of systematic variations in a process which give rise to a lack of quality control and suboptimal production economics.
The techniques used within SPC are based on the mathematics of statistical distributions, in particular the Gaussian (Normal) distribution, the Binomial distribution and the Poisson distribution.
Exercise
Watch this video on basic statistics to check your understanding of some key ideas, including data types and frequency distribution.
A characteristic of all raw materials, processes and chemical products are that they are subject to natural variation. ‘Variables’ are characteristics that can be measured on a scale, such as mass, length or strength, and will follow the Gaussian distribution. ‘Attributes’ are characteristics that are either ‘pass’ or ‘fail’ and will follow the Binomial or Poisson distribution. Only variables, and hence the Gaussian distribution, are considered here.
Exercise
For a general review of elementary statistics, view this series of videos from Larah Smith.
8.6. Gaussian distribution
A Gaussian distribution describes a distribution of continuous events and may be described by the equation:
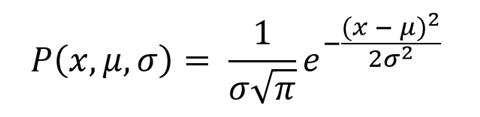
where P (x) is the probability of an event x occurring, in a distribution with meanμ and standard deviation σ. It may be represented graphically as below.
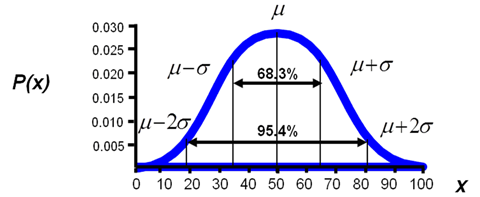
A range of +/– one standard deviations from the mean will contain 68.3% of the area of the distribution and +/– two standard deviations from the mean will contain 95.4% of the area. A range of +/– three standard deviations from the mean will contain 99.7% of the area of the distribution. This range is often used in statistical process control (see Shewhart charts).
8.7. Measures of the average of the distribution
Mean
The mean is the sum of measurements xi divided by number of observations n:
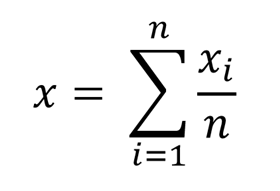
Median
The median is the value of the middle measurement when they are arranged in order of magnitude.
Mode
The mode is the most commonly occurring value.
For a perfect Gaussian distribution the mean, median and mode will all be the same value, but for an imperfect distribution they will be different depending on whether the distribution is top or bottom heavy as shown in the diagram below.
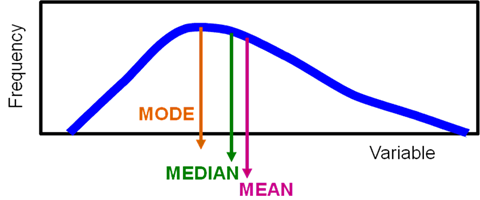
8.8. Measures of the spread of the distribution
Range
The range is the difference between the highest and lowest observations. It is simple to use, and is therefore commonly used within process control. However, the range increases as the number of observations increases and it uses only a proportion of the data available.
Variance
The variance is the mean squared variation:
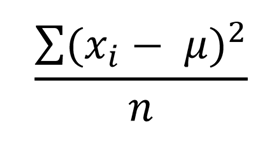
Standard deviation
The standard deviation is the square root of variance and can be calculated from the whole population using the formula:
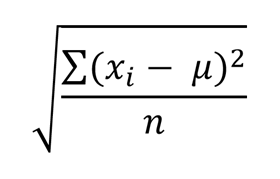
Alternatively, it can be estimated for a batch of n samples from the population using the formula:
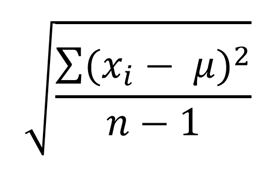
8.9. Accuracy versus precision
‘Accuracy’ and ‘precision’ have a specific meaning with quality control.
Accuracy refers to how close the measured values are to the correct value. In other words, how close the mean of the batch of samples is to the mean of the population.
Precision refers to the how close the measured values are to each other. In other words, how broad is the spread or standard deviation within the batch of samples.
This is illustrated in the diagram below for a batch of samples where each spot represents a sample measurement.
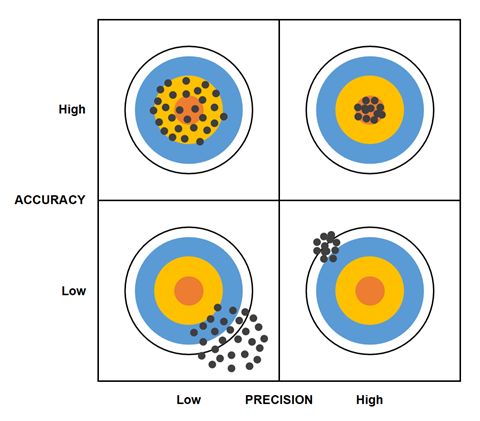
Ideally a process should be highly accurate and highly precise, but many factors may influence this in practice, such as the excess cost of achieving high accuracy or precision.
Exercises
- Check your understanding by watching this series of videos on accuracy and precision by Larah Smith.
- View this video tutorial on precision versus accuracy from The Chemistry Solution.
- Review the following resources which cover a wide range of topics in statistical process control including process capability (below) and Shewhart charts covered elsewhere in this resource:
- Statistical process control (SPC) (from MoreSteam)
- SPC, EPC and six sigma for process improvement (from Global Quality Village)
- Statistical process control (from the Centre for Innovation in Mathematics Teaching)
- Statistical process control resource centre (from Quality Training Portal)
8.10. Process capability
Process capability is a measure of how capable a process is able to achieve the specification for the product agreed with the customer.
Good management practice (see other topics in Quality assurance and control and Marketing) states that a product specification should be agreed with a customer and that it should be manufactured according to this specification with no defects. In the chemical industry, a specification may be a purity level, a weight or a concentration and will usually be variable in nature, which will show a Gaussian distribution about a mean μ and with a standard deviation σ.
Process capability Cp is defined algebraically as:
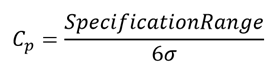
where the specification range is the difference between the higher specification level and the lower specification level.
Download this presentation on process capability to find out more, using the guide below.
Presentation guide
Start the presentation and click when prompted (see Using presentations in this resource).
- Process capability refers to the variability of the product in relation to the specification limits.
- If the process is producing a product according to the Gaussian distribution shown (click 1) and the specification range agreed with the customer is +/– 6 standard deviations in width (click 2) then the vast majority of the product will be within specification. This is termed a ‘high capability’ process (click 3).
- If the process is producing a product according to the Gaussian distribution shown (click 4) and the specification range agreed with the customer is +/– 3 standard deviations in width (click 5) then most of the product will be within specification. However, on average about 3% of product will be outside, and so fail the specification. This is termed a ‘medium capability’ process (click 6).
- If the process is producing a product according to the Gaussian distribution shown (click 7) and the specification range agreed with the customer is +/– 2 standard deviations in width (click 8) then the vast majority of the product will be within specification. This is termed a ‘low capability’ process (click 9).
- The process capability index Cp is calculated using the relevant formula (click 10). A rule of thumb is that a value of above 1 is high capability, below 1 is low capability and about 1 is medium capability.
- You may have already noticed that the process capability calculation assumes that the mean of the process is exactly in the centre of the specification range, which of course may not be the case. So while process capability indicates how well the spread of the process can fit within the specification range, we need another measure to show how well the mean fits within the specification range (click 11).
- Such a measure is process performance Cpk, which is defined algebraically as the lower of the two values (A and B):
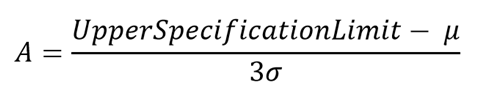
or
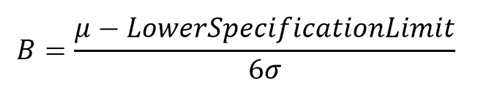
- If the mean of the process is exactly in the centre of the specification range then the process performance value will be identical to the process capability value. However, as the mean moves away from the centre of the specification range then the process performance value will become lower.
- The lower the value of the process performance compared to the process capability then the further the mean of the process is away from the centre of the specification range. Due to the shape of the Gaussian distribution the further the mean is away from the specification centre then there will be increasing amounts of product that will fail the specification. So a quality control manager should be constantly aware of the process capability and performance values of the process and if necessary take action to ensure that the mean of the process is in the centre of the specification range.
- Try the numerical example at the end of the presentation (click 12). Calculate the mean and standard deviation for the process by using a calculator with statistical functions. Interpret the results. The numerical answers are provided for you to check your answers (click 13).
Exercise
Download this worksheet on calculating process capability and process performance to consolidate your understanding of statistical process control.
8.11. Central limit theorem
The use of statistical process control techniques for variables, such as Shewhart charts, assumes that the underlying distribution of the variable follows a Gaussian distribution. So, before statistical process control techniques are applied by a quality control manager, the process should be shown to follow this distribution. This may be done by taking many measurements over time when the process is running correctly, or under statistical process control. From the long-term data, a Gaussian distribution may be demonstrated and a mean and a standard deviation may be determined for the process.
Subsequently, the aim for the company is to run the process so the mean and standard deviation remain the same over time and the process will produce a consistent product output within the range of the Gaussian distribution.
But what if the underlying population distribution is not Gaussian, but some other distribution? In this case, the statistical process control techniques based on a Gaussian distribution cannot be used. Here the central limit theorem can come to our rescue.
The central limit theorem states that if test samples are drawn in batches of size n from a population with an overall mean μ and a standard deviation σ, then as n increases in size the distribution of the batch means will approach a normal distribution. This distribution will have the same mean μ as the overall population mean and a spread given by the ‘standard error of the means’ represented by the equation σ/√n.
In other words, whatever the shape of the distribution of the individual data points within the population, if small batches are taken from the population and their means determined, then the distribution of these means will always be a Gaussian distribution. So, instead of taking individual samples from a process for quality control procedures, small batches of samples should be taken and the means of these small batches used for statistical process control purposes.
Download this presentation on the central limit theorem to find out more, using the guide below.
Presentation guide
Start the presentation and click when prompted (see Using presentations in this resource).
- Two frequency graphs are shown, one for individual sample values and one for the means of small batches of samples.
- Assume that the frequency distribution of the individual samples shows a square shape (click 1). If small batches of samples are taken from this population and the frequency of means plotted then a Gaussian distribution will result (click 2) with the same average value.
- Assume that the frequency distribution of the individual samples shows a triangular shape (click 3). If small batches of samples are taken from this population and the frequency of means plotted then a Gaussian distribution will result (click 4) with the same average value.
- In general, if a population (click 5) is sampled in batches with the mean of the batches plotted on a frequency plot, that population will give a Gaussian distribution (click 6) with an identical average to the population mean but with a narrower spread (click 7). This is because the range of a small number of samples will inevitably be narrower than the range of the whole population as the extreme values will only appear infrequently.
- The standard deviation of the mean frequency distribution is called the standard error of means σe and may be estimated by the equation (click 8):
Exercise
Try this simple activity designed to illustrate the central limit theorem. You can do the exercise yourself, or within a group by asking each member to pick a tile sequentially.
8.12. Shewhart charts
Walter A. Shewhart was an American statistician who developed statistical approaches within the telephone industry. For a manufacturing process, he distinguished between assignable cause errors (ie something has caused a change) and chance cause errors (ie random variation according to a Gaussian distribution). The number of assignable cause errors could be reduced or removed by adopting quality assurance techniques whereas chance cause errors are more inherent within the process.
Exercise
Explore the material on control charts, variables and attributes from this online course from Sam Houston State University. Make your own notes on what you find.
Shewhart control charts may be set up to detect systematic changes in the mean of a process and in the standard deviation (or range) of a process.
Download this presentation on Shewhart charts to find out more, using the guide below.
Presentation guide
Start the presentation and click when prompted (see Using presentations in this resource).
- A Shewhart chart attempts to provide a visual signal when a process is running ‘out of statistical control’, ie when there is a (significant) change in the mean (click 1, click 2) or a (significant) change in the standard deviation (click 3, click 4) or both (click 5).
- The chart is intended to help bring processes ‘into control’ and to help keep processes ‘in control’ (click 6). However, using a Shewhart chart can involve risks, namely that a legitimate extreme sample, which will always be possible from a Gaussian distribution, will give an action decision when no change has actually occurred in the process, or that a sample will fall within the control limits when there has indeed been a real change in the process (click 7).
- The Shewhart chart is designed around two types of limits, an action limit at +/– 3 standard errors of mean around the mean (this includes about 99.7% of the distribution) and a warning limit at +/– 2 standard errors of mean around the mean (this includes about 95% of the distribution) (click 8). The standard error of means is used rather than standard deviation because the process will be sampled in small batches (see Central limit theorem) to ensure a Gaussian distribution.
- In the chart set-up phase, an empty graph is prepared with time (eg every hour/day) on the horizontal axis and the batch average measurement on the vertical axis (click 9).
- The scale of the vertical axis should be chosen to include the full range of the actual and potential measurements. The graph is centred on the mean value of the process, determined in advance by repeated measurements when the process is running correctly. The scale of the horizontal axis is not critical because the chart is designed to continue in the future with points added to the graph in real time as the process runs continuously.
- The Gaussian distribution of the population of the process is illustrated against the vertical axis (click 10) together with the Gaussian distribution of the means of sample batches (see Central limit theorem) (click 11). A second graph on the same horizontal time scale is prepared for the standard deviation measurements. Again, the vertical axis should cover the actual and potential range of the values.
- The upper and lower action limits on the mean chart are drawn onto the chart at a distance of +/– 3 standard error of means distance from the mean (click 12). The upper and lower warning limits on the mean chart are drawn onto the chart at a distance of +/– 2 standard error of means distance from the mean (click 13).
- For the standard deviation chart, the standard deviation values from the sample batches are used and not the standard error of means. The upper and lower action and warning limits on the standard deviation chart are drawn onto the chart using a pre-calculated set of multiplers depending on the number of samples taken within the batch of measurements. The multiplers are shown in the table below.
| Number of samples in each batch measurement (n) | Lower action limit D(0.999) | Lower warning limit D(0.975) | Upper warning limit D(0.025) | Upper action limit D(0.001) |
|---|---|---|---|---|
| 2 | 0.00 | 0.04 | 3.17 | 4.65 |
| 3 | 0.06 | 0.30 | 3.68 | 5.05 |
| 4 | 0.20 | 0.59 | 3.98 | 5.30 |
| 5 | 0.37 | 0.85 | 4.20 | 5.45 |
| 6 | 0.54 | 1.06 | 4.36 | 5.60 |
- The blank Shewhart chart is now ready for use on a real time basis to monitor the process. Every time period a batch n of samples are taken from the process, the mean and standard deviation are calculated. These values are plotted onto the charts. A mean or standard deviation value that is within the control limits on the chart show that the process is behaving as expected according to the Gaussian distribution and nothing needs to be done. However, if the value is beyond the control limits then an ‘out of control signal’ is given if one of the following criteria are satisfied (click 14):
- When one point is outside the action limits
- When two successive points are outside the same warning limit
- When seven successive points are on one side of the mean
- When seven successive points are either increasing or decreasing
- An ‘out of control signal’ does not guarantee that the process mean or standard deviation are changing, but is just an indication that they may be and that the process should be carefully monitored and possible causes investigated.
- The following three slides provide an illustration of how a Shewhart chart may change as the process changes over time. Only when the Shewhart chart goes beyond the control limits is there evident of process change. Click through the slides and as the distributions move with time point out where the process could be deemed as being ‘out of control’.
Exercise
Download this worksheet on preparing a Shewhart chart to consolidate your understanding of how it may be used in quality control.
8.13. Cumulative sum (CuSum) charts
A cumulative sum or CuSum quality control chart is simple to use and gives a visual indication of potential problems affecting processes. The technique may also be used to show changes in the mean of any time related data, such a marketing sales figures.
Download this presentation on CuSum charts to find out more, using the guide below.
Presentation guide
Start the presentation and click when prompted (see Using presentations in this resource).
- A company manufactures batches of product with a specification of an impurity level of 4 units. The impurity level has been measured for 50 batches and does indeed show a mean of 4 units with a standard deviation of 1.784. But was the process under control?
- Impurity figures for the first 10 samples are given in the table. The first thing to do for a CuSum chart is to set a target value for the process. The target value is usually set as the long-term mean of the process and/or the middle of the product specification range, so set the target value as 4.0.
- For each batch, the deviation of the specification level from this target value is determined: for batch 1, this is 5 – 4 = 1 (click 1), for batch 2 it is 8 – 4 = 4 (click 2). Next, the CuSum is determined by adding together the deviation value for the batch in question to the sum of all the previous batches. So, for batch 1 the CuSum is equal to 0 + 1 = 1, for batch 2 the CuSum is equal to 1 + 4 = 5, and so on (click 3).
- The next slide (click 4) shows a graph of the impurity data for all the 50 batches and a graph of the CuSum data. It is immediately apparent that the random variation of the original impurity data has been smoothed out in the CuSum graph. The gradient of the CuSum graph represents the mean on the impurity data compared to the target value (click 5), so for a flat horizontal CuSum graph with a gradient of 0 the impurity level for the batches within this range will have a mean of the target value + gradient or 4 + 0 = 4. If the gradient is +1, the mean impurity will be 4+1=5, and if the gradient is –1, the mean impurity will be 4 – 1 = 3.
- A gradient scale may be added to the graph to make it easy to read off the process mean. Interpretation of the CuSum chart is about looking for trends and abrupt changes in the gradient of the graph. If the gradient changes abruptly then something radical may have happened in the process. This change is easier to spot on the CuSum graph because the original data is complicated by the underlying Gaussian variation.
- However, changes in the gradient do not necessarily indicate that the process has gone ‘out of control’. Statistical control can be investigated by constructing a V-mask based on the standard error of means from the data to use on the CuSum graph (click 6). This is usually prepared on a transparent sheet so it can be overlaid onto the CuSum graph.
- To prepare a standard V-mask:
- Draw a horizontal line left from an origin point (click 7) for a distance of 10 units at the same scale as the horizontal axis.
- Draw a vertical line at the right side of the horizontal line, centered at the end of the horizontal line, and equal to a distance of 10 standard error of means, at the same scale as the vertical axis (click 8).
- Draw a second vertical line at the left side of the horizontal line, centered at the end of the horizontal line, and equal to a distance of 20 standard error of means, at the same scale as the vertical axis (click 9).
- Join up the ends of the vertical lines to produce the upper (click 10) and lower (click 11) decision lines. If the lower decision line crosses the CuSum plot at any point over the last 10 data points, this signals an increase in the mean. If the upper decision line crosses the CuSum plot, this signals a decrease in the mean (click 12).
- The V-mask is used in real time as the CuSum graph is plotted one point at time for quality control of a process. However, it can also be used on historic data (click 13/14).
- The V-mask has been constructed using a standard error of means value of 1.4, which is a good estimate for the process when it is operating in control. Place the origin point of the V-mask onto the latest datum point, eg batch 1 (click 15), and move the V-mask along the CuSum graph (clicks 16, 17, 18, 19, 20, 21, 22, 23, 24 and 25).
- Watch if and when the CuSum graph goes beyond the V-mask control lines. If it does, an ‘out of control’ signal is indicated for the batch point at the origin of the V-mask.
- As with the Shewhart chart, an ‘out of control’ signal does not necessarily prove that the mean of the process has changed, but the probability of a change is high and so the process should be investigated.
- The last slide summarises the stages in the construction of a CuSum chart (click 26).
Exercise
Download this worksheet on preparing a CuSum chart to practice using the charts and doing related calculations.
8.14. Launching lemon bleach: developing quality control procedures
This activity gives you some practice in thinking about issues relating to quality assurance and control in the context of the ‘lemon bleach’ scenario used throughout this resource.
Download the worksheet and assume the role of a quality control manager, tasked with developing procedures to monitor product quality and ensure customer satisfaction.
9. Marketing
Having manufactured a product or developed a service, businesses need to sell to the right customers. As straightforward as this may seem, the process of finding and reaching out to the right customers is becoming increasingly difficult.
However, marketing is not just about selling. Most importantly, it is about knowing your customers and anticipating their wants and needs when developing new products and services. That is why it is increasingly common for scientists to work together with marketing teams to ensure development of the ‘right products’ that will generate demand.
In this topic, you will explore some common marketing models, as well as forecasting calculation methods, market research, advertising and more.
9.1. Hear from an industry expert
9.2. What is marketing?
The marketing of products or services manufactured by a company is a key management function.
The Chartered Institute of Marketing has defined marketing as ‘the management process which identifies, anticipates and supplies customer requirements efficiently and profitably’. They have considered marketing as:
- A ’concept’, ie ‘an attitude based on customers’ needs’
- A ‘process’, ie ‘a management activity to achieve customers needs’
- A ‘series of marketing techniques’ to ‘make the process possible’ (some of these techniques are introduced in this resource)
Christian Grönroos (Hanken School of Economics) emphasises the customer relationship aspect of marketing in his definition of marketing as an activity designed ‘to establish, maintain and enhance long-term customer relationships at a profit, so that the objectives of the parties involved are met’, accomplished ‘by mutual exchanges and fulfilment of promises’.
Exercises
- Listen to Christian Grönroos discuss his ideas about marketing in this interview.
- Watch these videos to hear about the ideas of Philip Kotler, a well-known American marketing expert and ‘business guru’:
- Philip Kotler: marketing strategy (London Business Forum)
- On marketing
- Steve Jobs, the founder of Applie, has said that marketing is about values. Listen to Jobs discuss his ideas in this video.
- Common themes about what marketing actually is can be picked out from the many definitions proposed. Watch this summary video on definitions of marketing to find out more.
Marketing functions may be grouped together into three main areas:
- Anticipating demand
- Obtaining demand
- Satisfying demand for the product you have on sale
Exercise
For each of the three functions of marketing above, make a list of activities that could be included within the function. When you have finished, compare your list with the activities included on this presentation slide.
The sections below introduce you to a selection of topics within the field of marketing and describe some simple models to help identify and understand customer requirements. You can also find some worked examples on trend forecasting to help anticipate future product demand, as well as links to wider scenario exercises from within the chemical related industries.
Further reading
- D. Mercer, Marketing, Blackwell, Oxford, 1996.
- P. Kotler and K. Lane Keller, Marketing management, Pearson, Harlow, 2015.
- P. Doyle and P. Stern, Marketing management and strategy, Pearson, Harlow, 2006.
- W. Hill, Marketing, Business Education Publishers, Sunderland, 1994.
- M. J. Baker, Marketing: an introductory text, Westburn Publishers, Helensburgh, 2006.
- J. S. Bayliss, Marketing for engineers, Peter Peregrunus, London, 1985.
- B. H. Elvy, Marketing made simple, Made Simple Books, Oxford, 1991.
9.3. Marketing or selling?
The terms ‘marketing’ or ‘sales’ are often used interchangeably within an organisation. There may be a ‘sales manager’ or a ‘marketing manager’ or both. They may be responsible for a similar role, or sometimes sales may be a subset of marketing or visa-versa.
However, the term used to describe the selling function of an organisation can indicate the underlying selling culture of the organisation. Two different extremes may be described as the ‘selling concept’ and the ‘marketing concept’, with an individual organisation often sitting somewhere between the two extremes.
Download this presentation on marketing and selling to explore these different approaches, using the guide below.
Presentation guide
Start the presentation and click when prompted (see Using presentations in this resource).
- The ‘selling concept’ starts from a factory manufacturing goods or services (click 1) and is focused on products (click 2) and how to sell as much as possible (click 3) to maximise the profitability of the company in the short term (click 4). An organisation following this approach will tend to focus on sales targets and achieving profits through maximising sales volume.
- The ‘marketing concept’ starts from an understanding of the marketplace for the product or service (click 5) and the needs of customers (click 6). This understanding will enable the organisation to coordinate its business (marketing, production, R&D, distribution) to meet these customers needs (click 7). If customer needs are met well then they will be very satisfied (click 8), and therefore more likely to buy the product again in the future. An organisation following this approach will tend to focus on customer satisfaction and developing long-term customer relationships, with the aim of maximising profits over the long term.
Exercise
For a commercial, charitable or educational organisation with which you are familiar, can you identify aspects of its product or service marketing strategy that fits with either the ’selling’ or the ‘marketing’ concepts? At what location along the selling to marketing continuum do you feel your organisation lies? How easy would it be to change this position? Prepare notes on your ideas.
9.4. The marketing ‘4Ps’ model
The marketing ‘4Ps’ model is a simplistic approach used to categorise many of the elements of setting a marketing strategy for an organisation into four main areas:
- Product
- Price
- Place
- Promotion
Although this may be a simple model, it does ensure that many of the aspects that should be considered when deciding how to market a product or service are actually reviewed, debated and decided upon by the organisation.
For each of these four categories, the question being asked is: ‘what is the marketing policy to be followed for the product or service in question in order to maximise its short-term and long-term profitability?’
Each of the 4P elements will be considered individually below. The basic 4P model has also been extended to the ‘7P’ model to cover aspects of more relevance to the services industries, where ‘People’, ‘Process’ and ‘Physical Evidence’ are added.
Exercise
Watch the following videos exploring the 4P (or 7P) model of marketing and make your own notes on what you find out:
Download this presentation on the 4P model to find out more about product, price, position and promotion, using the notes on each element below.
Product
The product component (click 1 in the presentation) refers to the exact nature, or specification, of the product that is going to be sold.
For example, a chemical company may manufacture phenol, but at what purity level? In what size (1 kg in glass bottles or 1 tonne containers)? Are any extra features to be included with the basic phenol product?
Exercise
Watch this video summarising the product element of the 4Ps model and make notes on what you learn.
Price
The price component (click 2) refers to the pricing policy to be followed by the company. Should the price be set high or low or the same relative to the market?
The price level will depend, for example, on the extent and number of competitors, whether the company has a patent or whether the product is new or mature.
Exercise
Watch the following video summaries of price in relation to marketing and make notes on what you find out:
Place
The place component (click 3) refers to the channels of distribution to be used for the product. For example, will it be sold to other chemical companies on the commodities market or to the general public via retailers or the internet?
Exercise
Watch the following video summaries of the role of place in marketing and make your own notes:
Promotion
The promotion component (click 4) refers to how the product is to be advertised or promoted. For example, will it be promoted using general advertising in public media or through personal interaction with large corporate buyers?
Exercise
Watch this video summary of promotion strategies and make notes on the main ideas.
People
The people component (click 5) deals with how the company deals with individuals, both employees and customers. This is particularly important to a service industry because how the company treats its customers will have a direct affect on its reputation and therefore on future business.
Process
The process component (click 6) refers to how the service is delivered. For example, a restaurant is basically a place for a customer to buy a prepared meal, but the process used by a high class cordon bleu establishment is very different to a fast food outlet.
Physical evidence
The physical evidence component (click 7) is concerned with how the company, and the selling outlet in particular, appears to visiting customers.
A customer walking into a hotel lobby that looks dark and dingy, or into a chemical company to see rusty equipment or liquid spills all over the floor, may decide to take their custom elsewhere.
The marketing mix
The marketing mix (click 8) is the complexity of how financial and other inducements interact to bring about a favourable seller–buyer relationship, aiming to bring satisfaction to the buyer and profit to the seller.
In other words, the marketing mix describes the particular combination of the 7Ps that are chosen for a given product. Each product will have different combination of the 7Ps, which will change over time as the competitive environment changes and the product moves along its lifecycle (click 9).
Exercise
- Review the following summaries of the marketing mix and make notes on what you find out:
- For a commercial, charitable or educational organisation with which you are familiar, select a product or service and describe the marketing mix used in terms of the 7Ps. Has your organisation made any changes recently to how it markets its product or service? Was this as a result of reacting to changes in the competitive market, or in an attempt to gain new competitive advantage?
9.5. Product life cycle
The product life cycle model uses the analogy of the population growth of a living organism to describe the growth of sales for a commercial product. A similar s-shaped or logistic curve may describe both processes. How the marketing of a particular product may be undertaken will depend on its location along the growth curve.
Exercise
- Search the internet for ‘product life cycle’, and make your own notes on what you find.
- Watch this video about the product life cycle.
Download this presentation to explore the different stages of the product life cycle, using the guide below.
Introduction
Start the presentation and click when prompted (see Using presentations in this resource).
The basic population growth curve is shown on the graph. For a product life cycle, the y-axis is changed from population to annual sales figures.
Stage 1: conception and gestation
- This (click 1) is the research and technology phase where new products are developed in the laboratory.
- Market research and test marketing are undertaken to judge the viability of the product then manufacturing plants are constructed.
- This stage requires heavy expenditure with no financial return. The finance for this may come from existing company funds, banks, shareholders or possibly government grants.
Stage 2: birth
- The product (click 2) is launched onto the market on a commercial scale and heavy promotional expenditure will be required.
- Production costs will be high and a skimming pricing policy is likely with a high price.
- At this stage, the costs will still exceed the revenue generated, so the cash flow will be negative and external financial support is still required.
Stage 3: growth
- The company is now experiencing a rapid increase in sales (click 3). Larger manufacturing plants are constructed, so the cost of production falls due to economies of scale.
- The product is highly profitable to the company and the high level of cash generated is used to provide a return to the investors.
- Some of this surplus cash should be used to invest in new products for the future. However, competitors will start to appear and in a response to forestall this competition prices will start to fall. Investment in marketing is used to stimulate growth.
Stage 4: maturity
- Product sales growth slows down (click 4). Many competitors are now in the market and competition for market share will be evident.
- A trend towards an oligopoly market model may be seen as some producers withdraw from the market. Only those producers with economies of scale and low cost structures will survive.
- The emphasis will be on non-price competition such as brands or reputation. The product is still profitable for the company but prices are close to costs so the profit margin is shrinking.
Stage 5: decline
- The annual sales start to decline (click 5). Overcapacity amongst producers is common and closures or mergers occur.
- There are low or negative profits, although for the producers remaining in the market positive financial returns are often stable over long periods of time. This is especially the case within the chemical industry due to the high level of investment needed to set up and run a chemical plant. This makes it less financially attractive for anyone else to enter the market to compete against a large company with existing economies of scale and expertise.
Stage 6: death
- The product is discontinued (click 6). However, in practice the product is usually superseded by a new version, a modified formulation or a product substitute and the life cycle repeats itself for the company.
9.6. The ‘SWOT’ model
The SWOT (strengths, opportunities, weaknesses and threats) model is a useful tool for managers to help identify the internal and external forces acting on an organisation.
Strengths and weaknesses are internal factors to an organisation, whereas opportunities and threats refer to external factors that are likely to have an impact on your business, for better or for worse.
Strengths
An organisation’s strengths are its distinctive resources and capabilities, which are likely to result in a competitive advantage and therefore higher profitability.
Weaknesses
The weaknesses of an organisation are those areas where it performs poorly compared to other similar organisations. These weaknesses are likely to be noticed by customers who will take their business elsewhere.
Opportunities
For organisations, opportunities may relate to new technology, ideas, markets, government initiatives, customer preferences and other developments that are likely to create new business. Is the organisation in a position to take advantage of these new developments?
Threats
Organisations may encounter a variety of threats as the marketplace changes continuously and for many different reasons. Is the organisation able to identify, adapt or respond to these changes?
Exercise
Watch the following videos on the SWOT model and make notes on what you learn:
Using SWOT
It is important that the absolute risk and importance of each item within this model are judged. For example, it would be an error to try to balance a weak opportunity against a strong threat.
The items identified using the SWOT model provide information to enable the future strategy for the organisation to be judged against a background of knowing as many factors affecting the business as possible.
Exercise
For a commercial, charitable or educational organisation with which you are familiar, identify the strengths and weaknesses of the organisation and the opportunities and threats it faces. Has your organisation made any changes recently to strengthen its business, such as starting up a new research grouping, or reacting to any threats such as government regulations?
9.7. Porter’s ‘five forces’ model
The five forces model was developed by Michael Porter in order to help management evaluate the external competitive forces that will have an impact on the profitability of a company. These ‘forces’, explained in the following sections, include:
- Power of suppliers
- Power of buyers
- Threat of substitutes
- Threat of potential entrants
- Industry competitives
Within each force, the question is asked: ‘what issues are there which will increase or decrease the profitability of the company within the market place for the product under analysis?’.
Power of suppliers
This force is concerned with the economic and commercial power of the suppliers of raw materials and services to the company.
For example, suppose the raw material supplier is a very large multinational corporation and the company is a small local chemical company making specialist products. It is highly likely that the company will not be able to negotiate the best possible price for the small quantity of raw materials it needs. The economic power is mainly in the hands of the raw material supplier so the profitability of the company will be low.
Power of buyers
This force is concerned with the economic and commercial power of the customers for the company product.
For example, if the company is small and trying to sell its product to a large organisation, then it is likely that the large organisation will be able to negotiate a low price and request discounts. The economic power will be in the hands of the customer so the profitability of the company will be low.
Threat of potential entrants
This force is concerned with the risk or chance that another company will decide to enter the market for the company’s product. The higher this risk, the lower the prices will have to be to discourage another company from entering, and so the profitability of the company will be low.
The company may act to protect its business. For example, it might take out a patent for the product or build a big manufacturing plant with economies of scale. This type of action could deter new entrants and enable the company to set a higher price, leading to higher profitability.
Threat of substitutes
This force is concerned with the risk or chance that a rival alternative product will enter the market and make the company’s product obsolete.
The greater the risk of a new product entering the market, such as a rival pharmaceutical company researching a new blockbuster drug in the field of the company’s product, the lower will be the long-term profitability of the company.
Industry competitiveness
This force is concerned with the market structure for the product.
If the market structure approaches a perfect model, the price will be an equilibrium price that is only slightly above breakeven point, and so the profitability of the company will be low.
If the market structure is a monopoly or oligopoly, the company will be able to set a higher price for the product and the profitability of the company will be high.
Exercises
- Download and work through this presentation on Porter’s five forces model. For each force, you can find a range of example scenarios leading to higher profitability for a company.
- Read Porter’s 1979 article, ‘How competitive forces shape strategy’, in the Harvard Business Review.
- Watch these two videos on Porter’s five forces:
- Porter’s five forces (Oxford Learning Lab)
- Porter’s five forces (Diploma in Marketing)
- For an commercial, charitable or educational organisation with which you are familiar, select a product or product segment and apply Porter’s five forces model. For each force section, make a list of your ideas.
9.8. Forecasting business trends
A major function of management is to plan for the future, so it is important to try to forecast business indicators such as sales demand, raw material prices and interest rates. An organisation can use these forecasts to help develop future strategy and to prepare a range of planning documents:
- The company budget
- This is an annual plan of sales figures, revenues and costs and other short term activities.
- A medium-term plan
- This usually covers a few years, and may be used for example to help plan production levels and maintenance scheduling, ensuring the sufficient supply of raw materials and the recruitment of new employees.
- A long-term plan
- This typically covers five years or more, and may be used for example to plan for major production capacity increases or to undertake long-term research and development initiatives.
In order to make these forecasts the company must gather historic data and try to extrapolate the observed trend into the future.
Trend equations
Download this guide and review the resources below to explore the theory behind four useful trend equations, including linear, polynomial, expontential and logistic functions.
Find out more about:
- Linear trend projection
- Quadratic (binomial) trend projection
- Exponential trend projection
- Logistic regression
Links with the product life cycle
The four trend equations described above may be used to represent different portions of a product life cycle:
- A linear equation may be used to represent straight line growth or constant sales
- A polynomial or exponential equation may be used to represent gradual or rapid increases or decreases in growth
- A logistic equation may be used to represent the whole S-shaped life cycle curve
Time series analysis
Some data, such as sales data, may incorporate a seasonal trend. Download this guide to explore time series analysis and the underlying theory for approaches to forecasting in these situations.
Exercises
- Write down a list of products and services that you expect to show a seasonal variation (the seasons involved need not be Autumn, Winter, Spring Summer of course).
- Review the following resources on time series analysis and make your own notes on what you learn:
- ‘Time series and forecasting’ (a chapter from D. Lind’s Statistical techniques in business and economics)
- Time series: moving averages (video from the Maths Doctor)
- Download this worksheet on time series analysis to practise forecasting a seasonal market.
9.9. Launching lemon bleach: marketing an aliphatic nitrile
This activity gives you the chance to practise thinking about marketing issues in the context of the ‘lemon bleach’ scenario used throughout this resource.
Download the worksheet and use a range of tools and models to prepare a marketing strategy document for a new chemical product.
10. Startups and spinouts
It may seem to many people that the chemical industry is dominated by large companies, and that the threshold for entry for new, small companies is prohibitively high. Some people may also think that starting a company being trained only in chemistry-based subjects would be very difficult.
In this section we will provide some insight into how to start a new company, whether in the field of chemistry or in any other area, since most business rules are universal. We will discuss how to take the first steps to obtaining funding to develop a new business, and look at the universities in the UK which harbour many startup businesses – a side of university life you might not be aware of!
10.1. Hear from an industry expert
10.2. Starting a company
All businesses in the chemical industry were once startups. Even though it seems that most of the ideas have been already exploited and commercialised, there are still emerging companies that enter the market with fresh ideas in various segments of the chemical industry.
The world is changing, population is growing and sales of products in emerging economies are rapidly growing and overtaking those in more developed countries. The problem of depleting fossil resources has presented an important opportunity for developing and commercialising ideas around green innovations. And if you think about the leading role the chemical industry will have in the future to provide the world with all of the resources it needs, keeping the population healthy and preserving the environment, the opportunities for developing a business are apparent and plentiful.
However, starting your own company can still seem impossibly daunting. Don’t panic though – it may be simpler than you think. All you really need is a great idea, some money, the right people and a plan.
Find out more
The UK Government is very supportive of new businesses, and tries to encourage people to think about starting their own business through various means. As a scientist, your big idea is most likely a surprising observation from your project, or some other passion of yours that may have a commercial value.
In this article from Chemistry World, Lionel Milgrom gives an interesting account of the process of creating a university spinout, covering the difficulties, rewarding moments, tedious bureaucratic procedures, making the difference and taking risks.
Exercises
- Try to imagine yourself being a scientist-entrepreneur setting up a company. What skills might help you to get started? What skills would you need to develop? What people would you take on board, and where would you go for help? Having prepared mentally to set up and run your own business, you could also translate that into running projects within a big company, that could require a similar skillset and a comparable level of planning and organization. And then, who knows, you might be running your own business one day!
- Most of us have had crazy ideas that might be the basis of a business. Write down a list of yours (they might be chemistry-based or not, and they might be based on products, services or something else). Your ideas might be genuinely realisable or fantastical in nature, but try to think of the next steps you would have to take if you wanted to set up a company to take your ideas forward.
10.3. Planning a business
So you’ve spotted this great opportunity for a business, and you’re confident that it will have commercial value once developed.
You might need some funding to develop your idea further, eg to create a prototype or run a pilot service. You then need to enter the market to find buyers and spread the word about your product or service. You will also have to crank some numbers to evaluate your costs and income to estimate profitability. And, last but not least, you will need to think about how your business is going to change over time to grow and diversify.
Put simply, you will need to plan, plan and plan again for all aspects of your business. Good planning is what helps to translate a good idea into a successful business.
This planning will not only help you to understand your future business, it will also help investors to decide whether to fund it or not. Funding might well be the third most important requirement for a successful startup, the first being a great idea and the second a skillful and motivated team.
This planning is achieved by writing a business plan, ie a detailed account of various aspects of the developing business: team members, finance, market, legal frameworks, future projections and so on.
Most commonly, the reason for writing a business plan is to pitch for investments. However, it is a good practice to keep a business plan always up to date, like a CV, to maintain full control and an in-depth understanding of it.
Find out more
You can find free templates and guidance on how to write a business plan on the UK Government website.
However, you will also find numerous other online resources packed with advice and examples of how to write a business plan. Having your own business could be very rewarding financially and morally, and many are seeking to start their businesses, so it is no wonder so much information is available online. You could also explore further information on setting up a business featured on the UK Government website.
There is no single formula to writing a business plan to suit all ideas. It is advisable to explore a number of resources and apply personal judgment on which points of the business plan need to be particularly well-highlighted.
By exploring what a business plan contains, you should notice that it brings together all of the topics covered in this resource, demonstrating that business planning never stops, but the plan is constantly re-evaluated and updated with ever changing internal and external industry environments.
Exercises
- In the previous section, you were asked to list any practical or even impractical ideas you might have had for starting a company. Pick one of those ideas now and outline how you would write it up into a business plan. What material would you include? Alternatively, you might be working as a chemist on placement or doing a university-based research project. Does that work lend itself to a marketable end-product or service? If so, think about drafting a business plan for that.
- You can also have a go at producing a full business plan in response to one of the practice scenarios included with this resource. (You might want to complete your review of each topic before tackling this.)
10.4. UK university spinouts
A lot of scientific startups are born on the lab benches in universities. In the UK, where there is a strong research academic community, it is no surprise that these startups are a part of the usual activity of many institutions.
Find out more
Not all aspects of startup companies are straightforward and not all strategies for development suit all businesses. The picture also varies from one university to another when it comes to startups.
However, there are some common success factors, collected in this review of chemical science spinouts by the Royal Society of Chemistry and the Chemistry Leadership Council, which will help you gain a good overview of the dos and don’ts of the academic spinout world. The report might also help you spot some spinout opportunities later in your life, and make them more successful.
There are also some common misconceptions surrounding spinouts, which you can learn about by reading this article by Ederyn Williams and Isabell Majewsky. The authors share some of their thoughts and experience from years of helping to develop university spinouts.
Exercise
Does your chemistry department have any spinouts? What is the nature of their business? What science lies behind them?
11. Practice scenarios
The following practice scenarios draw on a wide range of business topics by requiring you to produce a business plan to justify the set-up of a new business in response to a particular set of circumstances. The circumstances themselves are based on real situations so that you can compare your work with some information about ‘what actually happened’.
11.1. Launching lemon bleach
This scenario is used throughout this resource and features in various exercises accompanying the topics above. At the end, you produce a business plan that allows you to decide which of several fragrance components to produce and launch your ‘lemon bleach’ product range.
Download the lemon bleach scenario guide to find out more.
11.2. Waste-stream management
The waste-stream management scenario puts you in the position of an established manufacturer of chemical intermediates facing up to new environmental constraints. Changes are needed but the nature of the change depends on your business planning, not least your ability to turn an enforced change into a business opportunity.
Download the waste-stream management scenario guide to get started.
11.3. Drug reprofiling
In the drug reprofiling scenario, you are faced with encouraging data to suggest that you can use an existing drug to treat an important medical condition with which it has no prior connection. This attractive business opportunity side-steps many expensive legislative hurdles. Your business plan will illustrate how you could take your observation to market.
Download the drug reprofiling scenario guide for background notes and information about the tasks involved.
11.4. PET replacement
In this scenario, you are an established manufacturer of polyethylene terephthalate (PET) under pressure from soft drink manufacturers to improve the green credentials of packaging materials. The options to ‘green’ your product must satisfy the customers’ demands in terms of product quality, and also be demonstrably greener in the eyes of a sceptical public.
Download the PET replacement scenario guide to read the accompanying notes and find out more.
12. Notes for tutors
The Business Skills and Commercial Awareness for Chemists materials lend themselves to a number of formally assessed student activities if being used as part of an assessed course in business skills.
The most obvious opportunity presented here is the production of a business plan in response to one or more of the practice scenarios above.
The way this is carried out has other consequences for business skill development. For instance, the plan can also be accompanied by a business pitch, adding oral communication skills to the written skills, and can be made the responsibility of a group of students jointly, adding teamwork to the competencies being developed.
This resource provides tips and suggestions for students, including the recommendation that students should consider taking other courses available within their institution to supplement their engagement with these materials. The completition of such activities can also be made a formal requirement of a fuller course.
Throughout the individual topics above, there are a number of exercises where students are asked questions as opportunities for reflection, as well as activities that build on the materials provided. Formal written responses to these, in the form of a learning log or similar, offer another opportunity for reinforcement and assessment.
12.1. Download the materials
Download case studies, guidance notes and templates using the links below.
The materials also include editable MS Word versions of the practice scenarios, designed to facilitate adaptation of the required tasks, and observations on ‘what really happened’, offering additional perspectives based on the real background for each scenario.
Downloads
History of the Chemical Industry 1750 to 1930
Article | PDF, Size 87.93 kbSkills Required by New Chemistry Graduates report
Article | PDF, Size 0.85 mbCost equation calculation worksheet
Handout | PDF, Size 36.72 kbLinear cost equation worksheet
Handout | PDF, Size 39.08 kbNon-linear cost equation worksheet
Handout | PDF, Size 38.34 kbExploring the demand schedule - activity sheet
Handout | PDF, Size 30.16 kbMarket supply presentation
Presentation | PowerPoint, Size 0.2 mbPerfect market analysis presentation
Presentation | PowerPoint, Size 0.18 mbPerfect market pricing presentation
Presentation | PowerPoint, Size 0.16 mbPerfect market calculations worksheet
Handout | PDF, Size 36.27 kbMonopoly market analysis presentation
Presentation | PowerPoint, Size 0.2 mbMonopoly market calculation worksheet
Handout | PDF, Size 35.69 kbOligopoly market analysis presentation
Presentation | PowerPoint, Size 0.18 mbOligopoly market calculation worksheet
Handout | PDF, Size 35.27 kbCartel market analysis presentation
Presentation | PowerPoint, Size 0.18 mbDiscounted cash flow presentation
Presentation | PowerPoint, Size 0.9 mbDemand and supply curves calculation worksheet
Handout | PDF, Size 39.62 kbLemon bleach costing exercise
Handout | PDF, Size 0.23 mbPatent searching presentation
Presentation | PowerPoint, Size 0.32 mbReading a patent presentation
Presentation | PowerPoint, Size 0.87 mbPatents, licensing and market structure in the chemical industry
Article | PDF, Size 0.1 mbProcess capability presentation
Presentation | PowerPoint, Size 0.28 mbProcess capability worksheet
Handout | PDF, Size 31.48 kbCentral limit theorem presentation
Presentation | PowerPoint, Size 0.19 mbCentral limit theorem activity sheet
Handout | PDF, Size 27.62 kbShewhart charts presentation
Presentation | PowerPoint, Size 0.35 mbShewhart chart example worksheet
Handout | PDF, Size 30.36 kbCumulative sum (CuSum) chart presentation
Presentation | PowerPoint, Size 0.35 mbCumulative sum (CuSum) chart worksheet
Handout | PDF, Size 32.47 kbLemon bleach quality control exercise
Handout | PDF, Size 0.23 mbFunctions of marketing
Handout | PDF, Size 25.55 kbMarketing or selling presentation
Presentation | PowerPoint, Size 0.17 mb4Ps model of marketing presentation
Presentation | PowerPoint, Size 0.17 mbProduct life cycle presentation
Presentation | PowerPoint, Size 0.19 mbPorter's five forces presentation
Presentation | PowerPoint, Size 0.18 mbTrend forecasting guide
Handout | PDF, Size 53.38 kbTime series analysis guide
Handout | PDF, Size 58.05 kbTime series analysis example worksheet
Handout | PDF, Size 28.28 kbLemon bleach marketing exercise
Handout | PDF, Size 0.23 mbChemical science spinouts from UK universities report
Handout | PDF, Size 3.7 mbAcademic spin-off companies
Handout | PDF, Size 90.39 kbLaunching lemon bleach scenario guide
Handout | PDF, Size 0.7 mbWaste-stream management scenario guide
Handout | PDF, Size 0.77 mbDrug reprofiling scenario guide
Handout | PDF, Size 0.65 mbPET replacement scenario guide
Handout | PDF, Size 0.71 mb
Additional information
This resource was originally available as the Business Skills and Commercial Awareness for Chemists website, produced in 2012 as part of the National HE STEM Programme by the University of Warwick and the University of York.


No comments yet