Additions and corrections
A new mechanism for ozonolysis of unsaturated organics on solids: phosphocholines on NaCl as a model for sea salt particles
Federico Karagulian, A. Scott Lea, Christopher W. Dilbeck and Barbara J. Finlayson-Pitts
Phys. Chem. Chem. Phys., 2008, 10, 528–541 (DOI: 10.1039/B712715D). Amendment published 20th November 2012.
There was an error in converting the data on the time dependence of the secondary ozonide (SOZ) absorbance (Fig. 10) to rates of SOZ formation as a function of O3 (Fig. 12). This affects the values of the rate constants reported in the paper. However, the overall conclusions regarding the reaction mechanism and the effects of water and irradiation remain valid. Corrections for the kinetics are summarized below.
Kinetics section
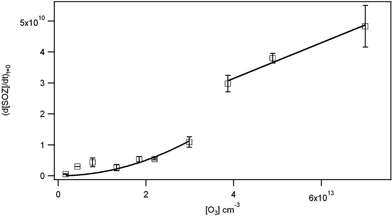
Fig. 10 is correct but Fig. 12 should be replaced by the following Figure:

Fig. 12. Initial rates of formation of SOZ (molecule cm−2 s−1) as a function of gas phase ozone concentration. Solid lines are the fits based on a first order dependence on ozone at high concentrations, and a second order dependence at low concentrations as described in the text.
As in the original paper, at high ozone concentrations, the rate of formation of SOZ is linear in ozone and approaches k1[O3][OPPC]. From the slope of the line at ozone concentrations from (3.9–7.0) × 1013 molecules cm−3, k1[OPPC] = (5.8 ± 1.6) × 10−4 (2s). Using an OPPC concentration of 3.2 × 10¹³ OPPC cm−2, a value for k1 of (1.8 ± 0.5) × 10−17 cm3 molecule−1s−1 is derived. This corresponds to a reaction probability of γ = 6 × 10⁻⁸. However, because of the non-linearity of SOZ formation over the range of ozone concentrations studied, the effective reaction probability varies. For example, converting the measured rate of SOZ formation at an ozone concentration of 2.3 × 10¹³ molecule cm−3 (0.9 ppm) to an effective reaction probability gives γ = 3 × 10⁻⁸. This order of magnitude is similar to that expected from the gas phase ozonolysis of alkenes, not higher as originally stated. This is attributed to the OPPC forming a non-fluid layer on the NaCl substrate, rather than a fluid, more porous and dynamic film as for OPPC on an aqueous substrate.
Fitting the data in Fig. 12 at lower O3 concentrations (<3 × 10¹³ molecule cm−3) to the form k1k4[O3]2[OPPC]/k2 as described in the original paper gives the fit shown in revised Fig. 12, from which a value is obtained for the ratio k4/k2 = (2.2 ± 0.9 ) × 10−14 cm3 molecule−1 (2s). Independent values of k4 and k2, and hence the lifetime of POZ with respect to thermal decomposition, could not be derived from the data.
With water vapor addition
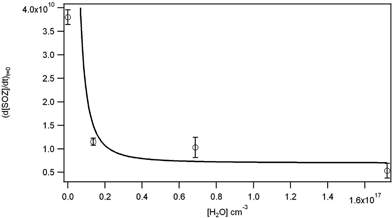
Fig. 13 shows the corrected dependence of SOZ on the water vapor concentration. The steep drop-off with increasing water indicates that the Criegee intermediate and/or the POZ are efficiently trapped by even small amounts of water. Eqn (VIII) of the original paper indicates that if water dominates the loss of the CI or POZ, the rate of SOZ formation should depend on the inverse water concentration to the first power for either CI or POZ reacting with water, or to the second power for both CI and POZ reacting with water. The dependence in Fig. 13 is best matched by variation of d[SOZ]/dt with [H2O]2, suggesting that both the CI and POZ are trapped by water. Given the complexity of the mechanism, rate constants for the individual steps involved cannot be extracted.

Fig. 13. Initial rate of formation of SOZ as a function of water vapor concentration at an O3 concentration of 5 × 10¹³ molecule cm−3. The line is of the form (d[SOZ]/dt)t=0 = A + B/[H2O]2.
Note that while the rate of SOZ formation decreases with water vapor concentration, the overall rate may not. As seen in Fig. 7 in the original paper, while the yield of SOZ decreases with water vapor, those of the carbonyl products increase. The loss of –CH2– groups at 2919 and 2850 cm−1 is also seen to increase with water vapor concentration, indicating a shift towards more volatile products such as the nine carbon aldehyde and/or acid that are removed in the gas stream.
Conclusions and atmospheric implications
Because unique values of the rate constants (except for k1) cannot be derived from the data, the individual estimated lifetimes in Table 4 are withdrawn. For a value of k1 = (1.8 ± 0.5) × 10−17 cm3 molecule−1 s−1 which can be derived from the revised data, the lifetime of OPPC with respect to the ozone reaction at 100 ppb O3 is 6 hours. From the ratio k4/k2 = (2.2 ± 0.9) × 10−14 cm3 molecule−1, under dry conditions 5% of the POZ will react with O3 at 100 ppb O3, with the rest decomposing to form CI and RCHO. The lifetime will be proportionally shorter, and the fraction of POZ reacting directly with O3 larger, as the ozone concentration increases. Given the rapid decline in SOZ in the presence of even small amounts of water vapor (revised Fig. 13), trapping of the CI and POZ by water under tropospheric conditions is likely to dominate the chemistry.
The Royal Society of Chemistry apologises for these errors and any consequent inconvenience to authors and readers.
Back to article

