 (1)
(1)Additions and corrections
Effect of ions on confined near-critical binary aqueous mixture
Faezeh Pousaneh, Alina Ciach and Anna Maciolek
Soft Matter., 2012, 8, 7567–7581 (DOI: 10.1039/c2sm25461a). Amendment published 16th October 2012.
The last term in eqn (82), namely
 (1)
(1)
should be replaced by the correct term which cancels the independent of L surface-tension contribution
 (2)
(2)
The difference between the terms given in eqn (2) and (1) is (see eqns (69)–(71) in the article)
 (3)
(3)
and since the parameters Rn,Rσ and n01 are independent of L, eqn (3) yields an additional contribution to A1(y) of the form (see eqns (71), (78) and (82) in the article)
 (4)
(4)
Adding this correction to eqn (42) we obtain
 (5)
(5)
i.e. the expression in eqn (42) should be multiplied by 2/(2y + 1). Good fits could be obtained with eqn (42) for A1(y), because the Casimir amplitude is larger than A1(y), and moreover the experimental range of temperature (hence of y) was relatively small.
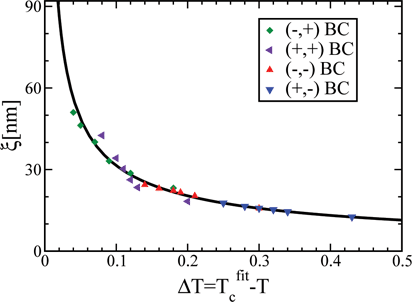
With the corrected formula we obtain the best fit for the amplitude of the correlation function ξ0 = 0.2 (nm), which perfectly agrees with the latest most accurate results by the same experimental group (ref. 14 in the article). Moreover, in the problematic case of the (+,+) boundary conditions (BC) we obtain a better fit, with the inverse screening length and the correlation length that agree better with expectations.
Fits of the correct expression to experimental data and the corresponding correlation length are shown in Figs 1 and 2, respectively. The best fit is obtained for the same values of ÂC, σ0, σL and for H2(0) and H2(L) 4.5 times the corresponding parameters found previously for all the surfaces. The shift in critical temperature is  = 4.5mK, 230mK, 6.2mK and 49mK for (-,-), (+,-), (-,+) and (+,+) BC, respectively. For (-,-) and (-,+) BC
  (nm), and for (+,-) and (+,+) BC
  (nm) and
  . For (-,-), (+,-) and (-,+) BC we assumed up to 5mK and for (+,+) up to 10mK inaccuracy in measurements of T. The remaining fit parameters for (-,-), (+,-), (-,+) and (+,+) BC are given in Tables I–IV, respectively.
Table I: (-,-) BC
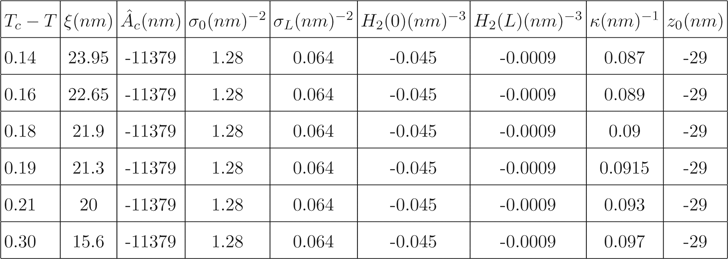
Table II: (+,-) BC
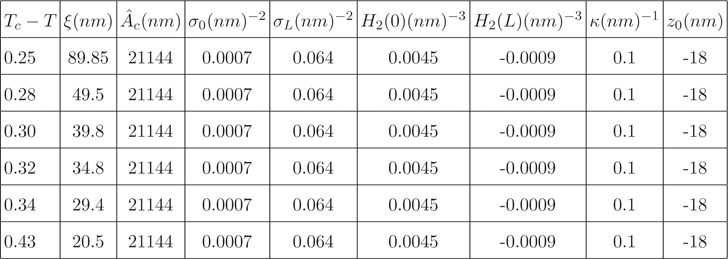
Table III: (-,+) BC
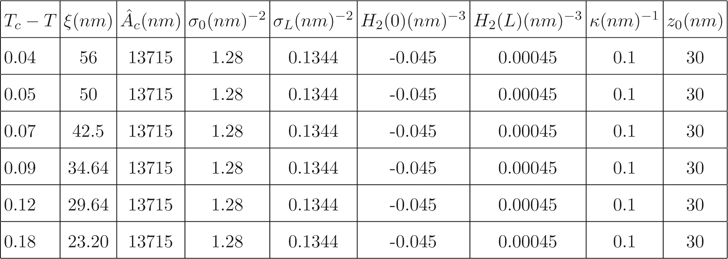
Table IV: (+,+) BC
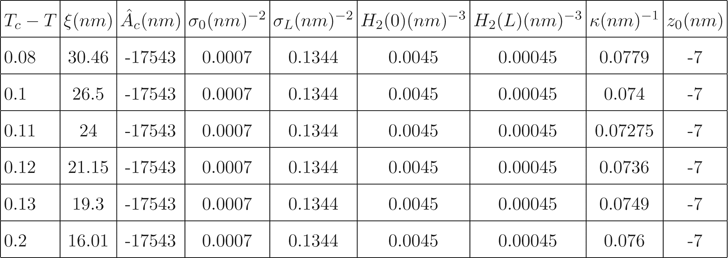
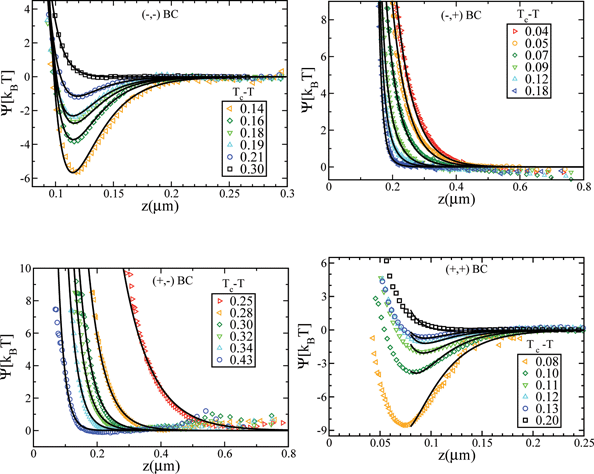
Figure 1: (Color online) Solid lines represent eqn (53) and (54) from the article, with the correct expression (eqn (5)) for A1(y). The boundary conditions (BC) are indicated in each plot.
The Royal Society of Chemistry apologises for these errors and any consequent inconvenience to authors and readers.
Back to article