| Phys. Chem. Chem. Phys., 2005, 7 | |
Additions and corrections Theory of the photodissociation of ozone in the Hartley continuum; effect of vibrational excitation and O(1D) atom velocity distribution |
Ezinvi Baloďtchaa and Gabriel G. Balint-Kurtib
a International Chair in Mathematical Physics and Applications (ICMPA - UNESCO CHAIR) andDepartment of Physics, Faculty of Sciences and Technology, University of Abomey-Calav, Benin;
E-mail:
ezbalo@yahoo.fr
b Centre for Computational Chemistry, School of Chemistry, University of Bristol, Bristol BS8 1TS, UK;
E-mail:
Gabriel.Balint-Kurti@Bristol.ac.uk
Phys. Chem. Chem. Phys., 2005, 7, 3829 (DOI: 10.1039/b511640f). Amendment published 2nd June 2010
Careful re-examination of the computer codes used to calculate the photodissociation dynamics in the title paper has uncovered some errors. The principal error occurred in the interpolation of the transition dipole moment surface and has resulted in the fact that the published cross sections and product state distributions in the paper are incorrect. The code has now been corrected and new calculations have been performed. In keeping with the comment of Schinke and Grebenshchikov,1 the number of angular grid points used has been increased from 32 to 70. All other parameters, i.e. grid sizes, number of radial grid points and total time, are the same as reported in ref. 2.
|
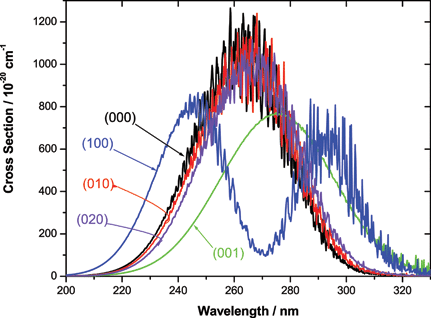
| Fig. 1 Calculated photodissociation cross section for O3 starting in different vibrational states, all with initial J = 0. |
Fig. 1 shows the calculated absorption cross section starting from different initial vibrational states of ozone. The molecule is initially has zero rotational angular momentum. The figure replaces Fig. 3 of ref. 2. The calculated cross sections now agree well with those published by Schinke and Grebenshchikov.1
Fig. 2 shows the calculated velocity distribution of the O(1D) atoms resulting from the photodissociation of O3 initially in its ground rotation-vibration state. The velocity distributions have been normalized so that the integral of the distribution over velocity yields unity. The peak velocity for the whole band is 2154.9 m s-1. Compared to experiment3 the peak of the calculated absorption spectrum is at too low energy by 0.206528 × 10⁻¹⁹ J and the calculated O(1D) + O2(a1 Δg) asymptote leads to too great an energy release by 0.097 eV (0.15541198 × 10⁻¹⁹ J). The overall relative kinetic energy release should therefore be increased by 0.051117 × 10⁻¹⁹ J, leading to an adjusted peak O atom velocity of 2214.42 m s-1 and a kinetic energy of 39.2 kJ mol-1. Fig. 2 is the corrected version of Fig. 5 of ref. 2.
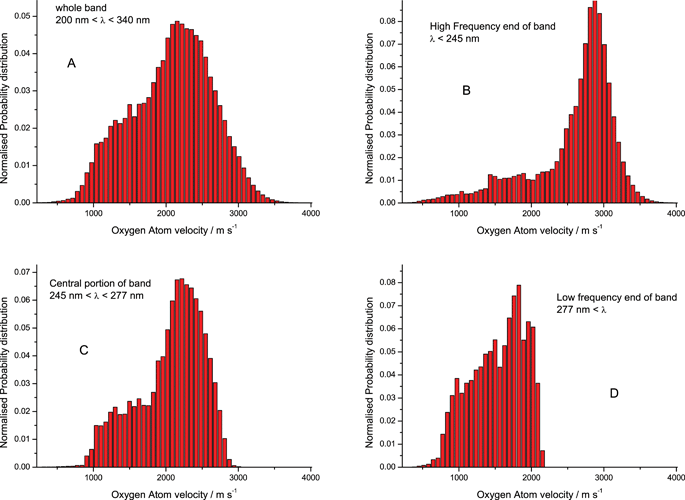 |
| Fig. 2 Calculated O(1D) velocity distributions arising from the photodissociation of ozone in the Hartley continuum. Velocity distribution arising; (A) from entire Hartley band 200 nm to 340 nm; (B) from high frequency range of the band 200 nm to 245 nm; (C) from central frequency range of the band 245 nm to 277 nm; (D) from low frequency range of the band 277 nm to 340 nm. |
The Royal Society of Chemistry apologises for these errors and any consequent inconvenience to authors and readers.