Additions and corrections
Theoretical and REMPI spectroscopic study on phenylhydrazine and phenylhydrazine¡V(Ar)n (n = 1, 2) van der Waals complexes
Daoqing Xiao, Dan Yu, Xiling Xu, Zijun Yu, Min Cheng, Yikui Du, Weijun Zheng, Qihe Zhu and Cunhao Zhang
Phys. Chem. Chem. Phys., 2009, 11, 3532–3538 (DOI: 10.1039/B818688J). Amendment published 29th May 2012.
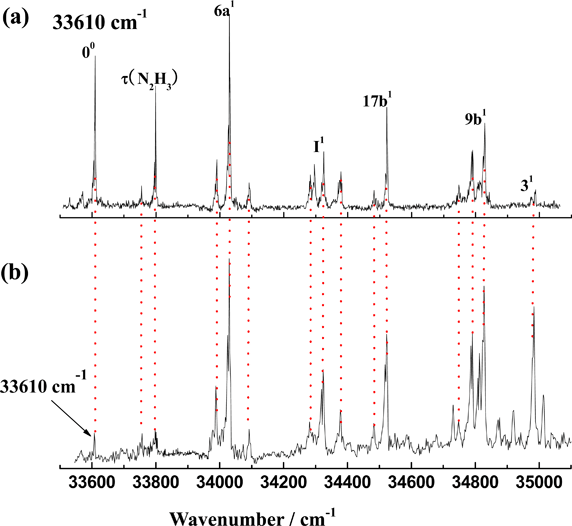
Some errors in the R2PI spectrum have recently been found. We recently found that, for the R2PI spectrum of phenylhydrazine in this paper, all the bands have almost the same frequencies as those of aniline (please refer to Fig. 1 below), showing that the R2PI spectrum assigned to phenylhydrazine in this paper may belong to aniline.

Fig. 1 R2PI spectrum of: (a) phenylhydrazine in this PCCP paper, (b) aniline (our new experiment). Note that additional experiments demonstrate that the bands within 33600–34000cm−1 in the 1C-R2PI spectra are the hot bands. Each band in Fig. 1a has a corresponding one of the same frequency in Fig. 1b, showing a high similarity between the two R2PI spectra. This means that the two R2PI spectra are most probably related to the same compound, since the R2PI spectrum is usually specific for each compound. Combined with the results of the UV and VUV experiments (Fig. 2), the R2PI spectrum assigned to phenylhydrazine in this PCCP paper should be re-assigned to the aniline.
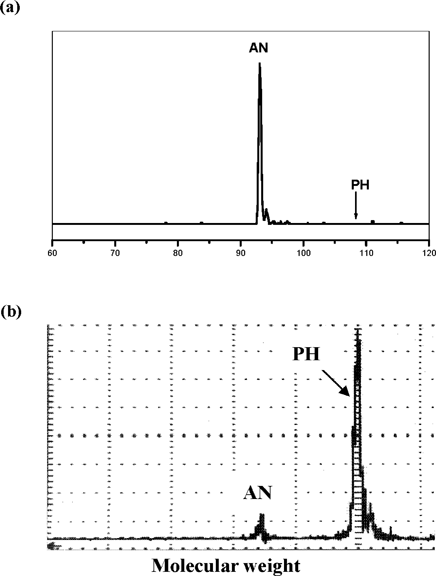
Additional experiments (Fig. 2) reveal that the phenylhydrazine cannot be ionized via the R2PI technique employed, since the phenylhydrazine in the S1 state dissociates fast to give aniline, which, unfortunately, misled us. The only 'sample' peak in the TOF-MS of phenylhydrazine ionized via the R2PI method (Fig. 2a) belongs to aniline, instead of phenylhydrazine. And hence the R2PI spectrum achieved according to this 'sample' peak belongs to aniline, the product of phenylhydrazine photodissociation.

Fig. 2 TOF-MS of phenylhydrazine. (a) two-photon ionization with nanosecond UV laser at λ = 295.19 nm; (b) one-photon ionization with nanosecond VUV laser at λ = 149.93 nm. Note that the absorption of one VUV photon can give the phenylhydrazine ion. The intense peak of thephenylhydrazine ion in Fig. 2b means that the phenylhydrazine ion is stable. The absence of the phenylhydrazine ion peak in Fig. 2a suggests that the intermediate state (excited state) caused by the absorption of the first UV photon dissociates/disappears quickly before the absorption of the second UV photon, and hence the two-photon ionization technique cannot give the phenylhydrazine ion.
After the problems were found, we tried to measure the correct R2PI spectra of phenylhydrazine and the Ar-containing complex, but we failed due to the fast photodissociation of phenylhydrazine in the S1 state. For the same reason, the measurement of the ionization potential is also incorrect.
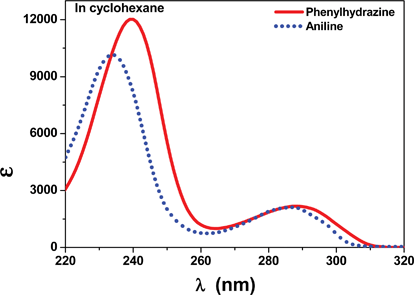
A careful check on the portion of theoretical study of this paper is conducted, and so far no problem is found. It seems that the p–p–π conjugation, the main finding/breakthrough of this paper, is still correct. The new experimental evidence is from the UV absorption spectra (Fig. 3): the red shift of S1←S0 transition band of phenylhydrazine with respect to that of aniline supports the formation of p–p–π conjugation in the S1 state of phenylhydrazine

Fig. 3 UV absorption spectra for phenylhydrazine (solid line) and aniline (dotted line) in cyclohexane. Note that the absorption band of the S1←S0 transition of phenylhydrazine (λmax = 288.1 nm) is red-shifted with respect to that of aniline (λmax = 286.9 nm). This is because that the formation of p–p–π conjugation in the S1 state of phenylhydrazine can lower the potential energy of phenylhydrazine in the S1 state, and hence lower the S1←S0 transition energy of phenylhydrazine
The Royal Society of Chemistry apologises for these errors and any consequent inconvenience to authors and readers.
Back to article