Additions and corrections
Effect of chromophore encapsulation on linear and nonlinear optical properties: the case of “miniSOG”, a protein-encased flavin
Nanna H. List, Frederico M. Pimenta, Lotte Holmegaard, Rasmus L. Jensen, Michael Etzerodt, Tobias Schwabe, Jacob Kongsted,* Peter R. Ogilby* and Ove Christiansen*
Phys. Chem. Chem. Phys., 2014, DOI: 10.1039/C3CP54470B. Amendment published 24th February 2014.
When reporting the data shown in Fig. 3 of the original manuscript, we used an incorrect molar extinction coefficient for the two-photon standard that was used over the wavelength range 630–780 nm (fluorescein in pH 11 water). As a consequence, the data shown in Fig. 3 of the original manuscript are based on an incorrect concentration of the two-photon standard. We also used an incorrect value for the concentration of miniSOG.
We have independently ascertained that the molar extinction coefficient of fluorescein in pH 11 water is (9.25 ± 0.06) × 104 cm−1 M−1 at 490 nm. When obtaining this number, the mass of fluorescein used in our calculations was corrected for the sample purity specified by the vendor. Our number compares well with what has been reported in the literature (i.e., 9.0 × 104 cm−1 M−1).1
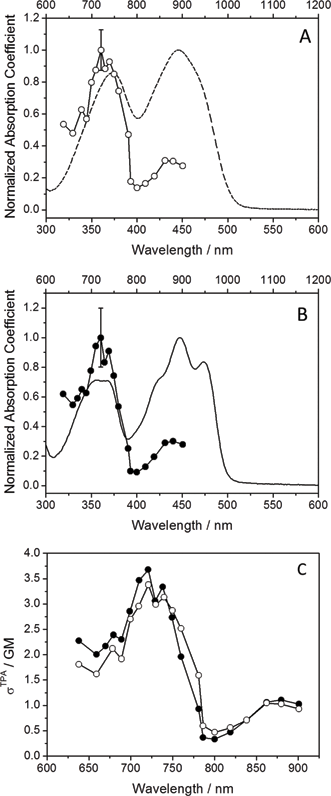
Using the accurate concentrations of fluorescein and miniSOG, we can readily correct the data shown in Fig. 3 of the original manuscript. This correction yields the following values for the two-photon absorption cross sections at the band maxima of 722 nm: σTPA(miniSOG) = 3.7 ± 0.7 GM and σTPA(FMN) = 3.4 ± 0.4 GM. Although these revised values are slightly larger than what we originally reported (2.2 and 1.8 GM, respectively), the context and conclusions of our original manuscript are not changed. It is important to note that, in making these measurements, we did not correct for the purity of FMN specified by the vendor (73–79%, where other related flavins likely contribute to the mass balance).
Fig.3 should appear as below:
Fig. 3 Experimental data. (A) Two-photon (open circles) and one-photon (dashed line) absorption spectra of FMN. (B) Two-photon (filled circles) and one-photon (solid line) absorption spectra of miniSOG. (C) The miniSOG (filled circles) and FMN (open circles) two-photon spectra are plotted together. In panels A and B, the wavelengths for the one-photon experiments are shown on the bottom abscissa, whereas the wavelengths for the two-photon experiments are shown on the top abscissa. The error bars shown in panels A and B are the standard deviation on an average of two independent measurements made at that wavelength.
References
1.W.-C. Sun, K. R. Gee, D. H. Klaubert and R. P. J. Haugland, Org. Chem., 1997, 62, 6469–6475.
The Royal Society of Chemistry apologises for these errors and any consequent inconvenience to authors and readers.
Back to article