


By designing and building their own visible-light spectrophotometers, students get to grips with the underlying principles of this widely used analytical tool
-
Take a 100 W light bulb, a light-dependent resistor, a prism or grating in front of a slit, and a curtain - and voilà, a DIY spectrophotometer
Spectroscopy is widely taught at A-level and at undergraduate level and, as scientific instruments become more affordable yet more sensitive and complex in their workings, it is increasingly important for students to understand their underlying principles. Most spectrophotometers in the teaching laboratory are driven by a computer, which controls the operations, stores files and manipulates the data, leaving students divorced from the physical processes that lead to the measurement. Indeed, when we asked a class of first-year undergraduates who had recently used an ultraviolet-visible (UV-VIS) spectrophotometer to explain its internal workings, only one out of 20 showed a clear understanding.
To overcome this problem we have developed a project that allows students to design and build their own visible-light spectrophotometer, giving them hands-on experience of the intimate workings of this analytical instrument at a cost that compares favourably with conventional synthetic chemistry experiments. Not only do students learn about the key components of the equipment, but they also gain experience of calibrating the instrument and an understanding of the relationships between the absorption of light and concentration, and between resolution and sensitivity. While the experiments described in this article were designed for undergraduates, they can also be adapted for 16–18 and 14–16 projects. (A summer camp of 13–16-year olds enthusiastically built photometers with a high degree of success.)
The full undergraduate practical is run over two days, the first task being to build a simple photometer. If time is limited, this can be used as a stand-alone exercise. In the second part of the practical the students design and construct a spectrophotometer and use it to measure the visible spectrum of a solution of potassium manganate(VII).
Building the photometer
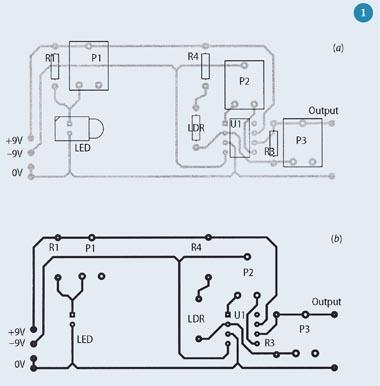
In our classes, we supply a printed circuit board and teach the students to solder, an important skill for anyone who regularly deals with scientific equipment. Alternatively, a board may be etched and drilled (a layout is shown in Fig 1)1, or the circuit may be built on plug-board, which may be more suitable for schools since many science departments will already have these, and the components can be reused.
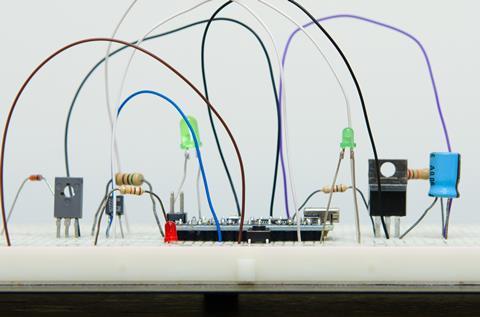
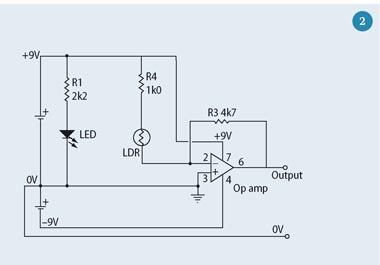
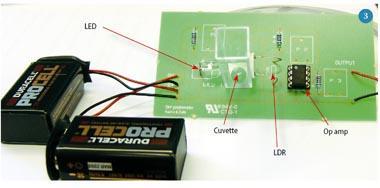
The photometer consists of a light source (an LED), a light-dependent resistor (LDR) as a detector and a simple amplifier/buffer circuit to make the output suitable to drive a voltmeter. (If a high impedance multimeter is used, the amplifier could be omitted, but it does illustrate an important component of a 'real' photometer.) The LED and LDR face one another and the sample cuvette is placed between them. The resistance of the LDR decreases as the amount of light that falls on the LDR increases: more light lets more current flow. The circuit runs on two 9 V batteries. To avoid errors caused by stray light from the room, the photometer must be placed in a box. Figures 2 and 3 show a photometer circuit diagram and a photograph of the completed photometer respectively. Components P1, P2 and P3 are generally omitted but may be used to replace the fixed resistors with potentiometers, thus allowing control over the light intensity, and gain and offset of the amplifier circuit. (These could be exploited for an extended project.)
Experimental
The relationships between absorbed and transmitted light, and between concentration and absorbance, may be explored with the photometer. However, the photometer must first be calibrated using standard concentrations of a suitable coloured chemical. We have used potassium manganate(VII), cobalt salts, molybdenum blue (sodium molybdate(VI) colour of the LED to improve the sensitivity. All compounds absorb some of the light that falls upon them, the energy from the radiation being used to excite electrons to higher energy levels. The absorbance, A, of a solution of the compound at a particular wavelength is described by the Beer-Lambert law (i), which is widely used in quantitative analysis.
A= -log10( I / Io) = εcl (i)
The absorbance is directly related to the concentration, c, of the compound, the pathlength of the sample, l, and the molar absorption coefficient, ε, a wavelength-dependent constant characteristic of the compound. Io is the incident light intensity and I, the transmitted light intensity.
Rather than measuring absorbance directly, the photometer gives information as a voltage. This is true of commercial instruments, though these contain an internal processor to do the necessary mathematics. However, the conversion is straightforward and can readily be done with a calculator or spreadsheet.
As well as absorption by the compound, other processes reduce the intensity of light that passes through the cuvette, so it is essential to take a 'background' reading for the solvent and the cell, which corresponds to Io. Do not assume that the circuit sends out 0 V when no light falls on the detector, and make the correction by subtracting the voltage at zero light (Vzero) from all readings. These two procedures 'zero' the photometer. Over the range of wavelengths and light intensities in which we are interested, the photometer exhibits a linear relationship between incident light and the voltage ratio described in equation (ii). (This assumption holds true for useful concentration ranges, and the calibration plot will let the user know if they have entered a region of non-linear behaviour.)
I / Io = Isample / Isolvent
= (Vsample - Vzero)/(Vsolvent - Vzero) (ii)
Some older needle-type voltmeters may be set to zero manually, which simplifies the maths.
The absorbance is calculated by combining equations (i) and (ii) into (iii). After calibration, using a set of standard solutions to determine ε, measurement of A allows the concentration of unknown solutions to be determined.
A = -log10((Vsample - Vzero)/(Vsolvent - Vzero))
= εcl (iii)
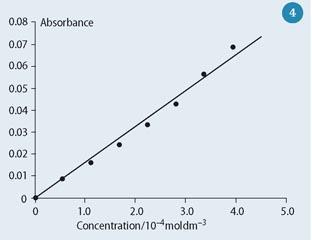
Figure 4 shows a student calibration plot of concentration against the voltage ratio. The completed photometers have proved suitable for monitoring kinetics of reactions that involve a colour change, eg measuring the rate of bleaching crystal violet in the presence of sodium hydroxide.
The spectrophotometer
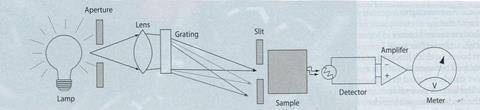
In addition to a light source (100 W light bulb or other polychromatic sources) and detector, a spectrophotometer also requires a prism or grating to obtain different wavelengths from the light source, and a slit to select a narrow range of wavelengths. The latter determines the resolution of the instrument.
There is, however, an inherent compromise between sensitivity and resolution - a narrower slit gives better resolution, but fewer photons with which to make the measurement. The slit may be made carefully from card, and placed either between grating and sample, or between sample and detector.
Figure 5 shows a typical layout of a 'DIY' spectrophotometer, where the spectrum produced by the grating is projected onto graph paper to produce a scale of wavelength. The grating may be rotated, or the slit and sample moved, to select different wavelengths of light. Calibration of the wavelength is performed by eye, using the numbers in Table 1 as a guide.
To construct a spectrum, the absorbance must be calculated for each wavelength, and therefore Vzero, Vwater and Vsample must be measured at each point. Ambient light interferes with the spectrophotometer and causes inaccuracies, and so either large cardboard boxes, or thick blackout curtains draped between two or three retort stands, are used to keep out light. The latter is preferable because the students can work under the material. There is no single correct way of assembling a spectrophotometer, and we find that students often have ideas that we have not anticipated. A simple instrument can be created by using coloured filters in place of the grating-lens-slit assembly, though the number of data points is limited to the number of available filter colours.
| Colour | Wavelength centre/nm | Wavelength range/nm |
|---|---|---|
| Violet | 410 | 400-430 |
| Blue | 470 | 430-390 |
| Green | 520 | 490-570 |
| Yellow | 580 | 570-595 |
| Orange | 610 | 595-650 |
| Red | 650 | 650-700 |
A valuable experience
This hands-on, discovery-based learning encourages ingenuity and creativity, and gives the students a real sense of achievement. If constructed with care and ambient light is excluded effectively, the photometer is sufficiently precise to make measurements that are comparable with the students' abilities to make up calibration solutions. It is certainly good enough to measure unknown concentrations and the rates of simple reactions to within a few per cent.
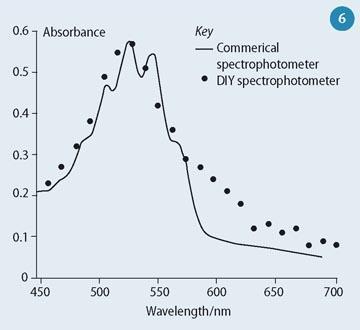
Building the spectrophotometer is challenging and we deliberately avoid giving explicit instructions, though some students require more guidance than others depending on their ability, confidence and experience. The process of trial and error ensures that every component is explored and its purpose understood. The ability to resolve the spectrum is limited by how widely the light source is diffracted, and though the fine structure of the KMnO4 spectrum cannot be resolved, the spectra obtained broadly resemble those from commercial instruments at a fraction of the cost (Fig 6). We have found that the learning outcomes are worth the work - after running the experiment, all the students understood the Beer-Lambert law and how a spectrophotometer works.
Parts list
Photometer
- Printed circuit board (£1.90 each for a run of 104), plug-board, or photoresist board
- Voltmeter or digital multimeter
- Plastic or glass cuvettes
Total cost for photometer consumables is under £4.00
Spectrophotometer
- White light source
- Diffraction grating, prisms or coloured filters. (Note: gratings are available at modest cost and work better than prisms.)
- Lenses
- Optical bench or stands and clamps; black cloth
- Resistors: 4.7 k (£0.02); 2.2 k (£0.02); 1.0 k (£0.02)
- LED: orange, 5 mm (£0.20)
- LDR (£0.57)
- Op amp: 3140 (£0.65)
- Socket: eight-pin (£0.09)
- Battery clips (£0.26)
- Soldering iron, solder,
- Blu-Tack, tape and card
Acknowledgements: we thank Ed T. Bergström and Laura Karran for their help in developing this experiment.
References
- See, for example, http://www.technologystudent.com/pcb/pcbdex.htm
- Data from various sources, including D.A. Skoog, D. M. West, F. J. Holler and S. R. Crouch, Fundamentals of analytical chemistry (8th edn). Belmont, US: Brooks/Cole-Thomson Learning, 2004.


1 Reader's comment