


What effect does temperature have on reaction rates? With a little sodium thiosulfate and hydrochloric acid, students will be able to discover just that
Complete the table provided to give a clear view of the data collected, and explore temperature, reaction rates, and collision theory.
This experiment should take 60 minutes.
Equipment
Apparatus
- Eye protection.
- Conical flask, 250 cm3
- Measuring cylinder, 10 cm3
- Measuring cylinder, 50 cm3
Chemicals
- Sodium thiosulfate solution 40 g dm–3
- Hydrochloric acid 2 mol dm–3
Health, safety and technical notes
- Read our standard health and safety guidance.
- Wear eye protection.
- Ensure good ventilation, use fume cupboard if necessary.
- Sulfur dioxide is formed as a by-product, see CLEAPSS Hazcard HC097.
- For more information on sodium thiosulfate, see CLEAPSS Hazcards HC095a.
- Hydrochloric acid is an irritant, see CLEAPSS Hazcard HC047a.
Procedure
- Put 10 cm3 of sodium thiosulfate solution and 40 cm3 of water into a conical flask. Measure 5 cm3 of dilute hydrochloric acid in a small measuring cylinder.
- Warm the thiosulfate solution in the flask if necessary to bring it to the required temperature. The object is to repeat the experiment five times with temperatures in the range 15–55 °C.
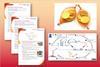
- Put the conical flask over a piece of paper with a cross drawn on it.
- Add the acid and start the clock. Swirl the flask to mix the solutions and place it on a piece of white paper marked with a cross. Take the initial temperature of the mixture
- Look down at the cross from above. When the cross disappears, stop the clock and note the time taken. Record the final temperature of the mixture in the flask.
- As soon as possible, pour the solution down the sink (in the fume cupboard if possible) and wash away.
- Record your findings on the table provided.
| Initial temperature of the mixture in the flask/°C | Final temperature of the mixture in the flask/°C | Average temperature of the mixture in the flask/°C | Time taken for the cross to disappear/s | 1/time taken/s–1 |
|---|---|---|---|---|
Notes
The method for this experiment is best understood when the teacher demonstrates it first.
The endpoint can be measured with a light sensor connected to a data-logger. A light sensor set up as a colorimeter can be used to monitor the precipitation on a computer – clamp a light sensor against a plastic cuvette filled with the reactants.
The result, in the form of graphs on the computer, provides very useful material for analysis using data logging software.
The software shows the change on a graph, and this tends to yield more detail than the end-point approach used in this experiment.
The rate of change can be measured from the graph slope or the time taken for a change to occur.
As soon as the reaction is complete, pour the solutions away, preferably into the fume cupboard sink. Wash away with plenty of water. This is particularly important with solutions used at higher temperatures.
Questions
- For each set of results, calculate the value of 1/time. (This value can be taken as a measure of the rate of reaction for this experiment).
- Plot a graph of 1/time on the vertical (y) axis and average temperature on the horizontal (x) axis.
Downloads
The effect of temperature on reaction rate - teacher notes
PDF, Size 0.12 mbThe effect of temperature on reaction rate - student sheet
PDF, Size 0.15 mb
Additional information
This practical is part of our Classic chemistry experiments collection.


No comments yet